Estadística descriptiva y contraste de hipótesis en R
Análisis de datos con R
Máster Universitario en Gestión Ambiental y Biodiversidad. Universidad de Córdoba (España)
- Tema 1: Introducción a R y programación
- La estructura de R
- Funciones, objetos y programación básica
- Entorno (sesión de R) y directorio de trabajo
- Trabajar con archivos (scripts y datos)
- Tema 2:
- Instalación de paquetes
- CRAN
- GitHub
- Graficado
- Tema 3:
- Estadística descriptiva
- Contraste de hipótesis
- Paramétricos vs No paramétricos
Estadística descriptiva
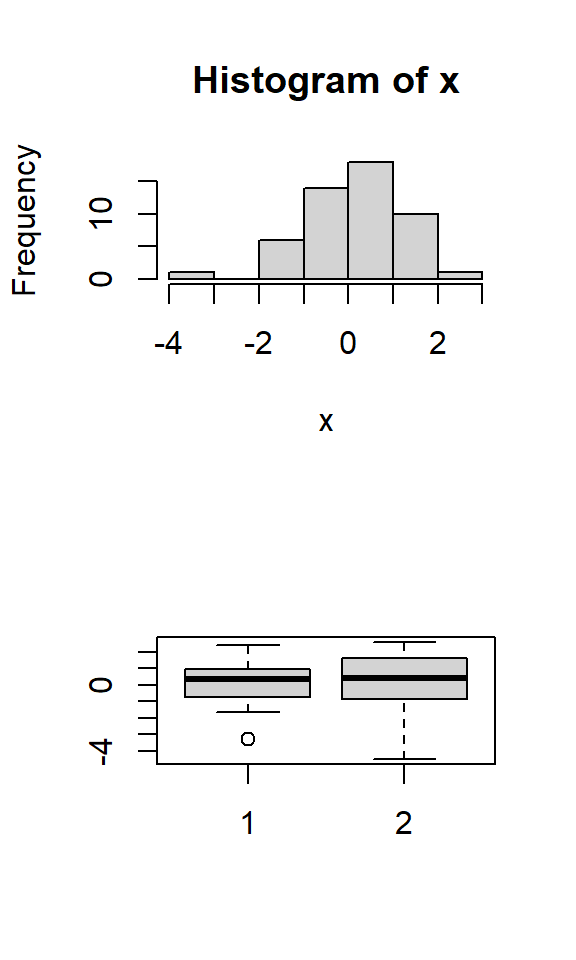
Ya hemos visto algunas funciones en los ejercicios de días anteriores
Algunas de ellas para hacerlo de forma gráfica
Contraste de hipótesis
Test estadísticos en R
Los usamos para realizar el contraste de hipótesis
Este es el motivo principal por el que usamos R (y no C++)!
¿Qué test estadísticos de contraste de hipótesis conocéis?
T de Student: Comparación de medias de 2 muestras
    Welch Two Sample t-test

data:  x and y
t = 0.87007, df = 31.382, p-value = 0.3909
alternative hypothesis: true difference in means is not equal to 0
95 percent confidence interval:
 -0.7282908  1.8129164
sample estimates:
mean of x mean of y
 5.270351  4.728039
T de Student de una muestra
Se usa para comparar una muestra con una distribución teórica. Por defecto, con media 0.
    One Sample t-test

data:  x
t = 21.769, df = 29, p-value < 2.2e-16
alternative hypothesis: true mean is not equal to 0
95 percent confidence interval:
 4.153551 5.014937
sample estimates:
mean of x
 4.584244


    One Sample t-test

data:  x
t = -1.9743, df = 29, p-value = 0.05794
alternative hypothesis: true mean is not equal to 5
95 percent confidence interval:
 4.153551 5.014937
sample estimates:
mean of x
 4.584244
T de Student: Hipótesis nula
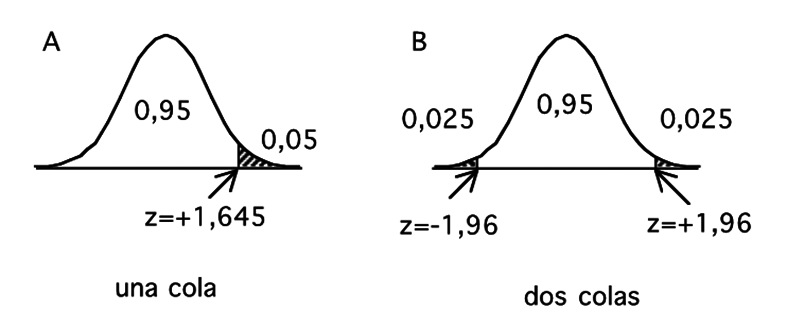
Se puede especificar para realizar un análisis de una cola.
T de Student: Hipótesis nula
Se especifica con el argumento alternative
    Welch Two Sample t-test

data:  x and y
t = -3.3819, df = 54.959, p-value = 0.9993
alternative hypothesis: true difference in means is greater than 0
95 percent confidence interval:
 -1.462238       Inf
sample estimates:
mean of x mean of y
 4.776745  5.755020


    Welch Two Sample t-test

data:  x and y
t = -3.3819, df = 54.959, p-value = 0.000666
alternative hypothesis: true difference in means is less than 0
95 percent confidence interval:
       -Inf -0.4943129
sample estimates:
mean of x mean of y
 4.776745  5.755020
T de Student: Pruebas pareadas
Se usa cuando las muestras no son independientes, están interrelacionadas
    Paired t-test

data:  x and y
t = -1.9393, df = 29, p-value = 0.06225
alternative hypothesis: true mean difference is not equal to 0
95 percent confidence interval:
 -0.91113102  0.02422196
sample estimates:
mean difference
     -0.4434545
T de Student: devuelve un objeto
List of 10
 $ statistic  : Named num -4.3
  ..- attr(*, "names")= chr "t"
 $ parameter  : Named num 57.8
  ..- attr(*, "names")= chr "df"
 $ p.value    : num 6.75e-05
 $ conf.int   : num [1:2] -1.739 -0.633
  ..- attr(*, "conf.level")= num 0.95
 $ estimate   : Named num [1:2] 4.78 5.97
  ..- attr(*, "names")= chr [1:2] "mean of x" "mean of y"
 $ null.value : Named num 0
  ..- attr(*, "names")= chr "difference in means"
 $ stderr     : num 0.276
 $ alternative: chr "two.sided"
 $ method     : chr "Welch Two Sample t-test"
 $ data.name  : chr "x and y"
 - attr(*, "class")= chr "htest"
[1] 6.750649e-05
[1] -0.6334078
[1] 6.750649e-05
Test paramétricos versus no paramétricos
Los test parámetricos
- Asumen distribuciones estadísticas subyacentes a los datos.
- Deben cumplirse algunas condiciones para que el resultado de la prueba sea fiable.
- Tienen más potencia estadística y deberían ser la aproximación usada si se puede.
Los test no paramétricos
- Las pruebas no paramétricas no dehen ajustarse a ninguna distribución.
- Pueden aplicarse aunque no se cumplan las condiciones de validez paramétricas.
- Son más robustas, en el sentido de que pueden usarse sin cumplir requisitos, pero tienen menos potencia estadística:
- Necesitan más tamaño de muestra
- Necesitan más diferencias para poder detectarlas
Equivalencias
| Test | Pruebas paramétricas | Pruebas no paramétricas |
|---|---|---|
| 1 muestra | t Student (1 muestra) | Wilcoxon (1 muestra) |
| 2 muestras dependientes | t Student (pareado) | Wilcoxon (pareado) |
| 2 muestras independientes | t Student (no pareado) | U Mann-Whitney |
| > 2 muestras dependientes | ANOVA de una vía | Friedman |
| > 2 muestras independientes | ANOVA factorial | Kruskal-Wallis |
| Correlación entre dos variables | Pearson | Spearman |
¿Cómo se si puedo usar un test paramétrico?
- Normalidad
shapiro.test(x)ks.test(x, y = c("pnorm", "pgamma", "pbinom"))
- Homocedasticidad
var.test(x, y)
¿Cómo realizo el test no paramétrico?
Acepta todos los argumentos de la T de Student
ANOVA (Analisys of Variance)
Se usa para comparar medidas entre grupos
Es un test paramétrico (normalidad, homocedasticidad)
Call:
   aov(formula = medidas ~ grupos, data = data)

Terms:
                  grupos Residuals
Sum of Squares  91.95371  95.64582
Deg. of Freedom        2        27

Residual standard error: 1.882136
Estimated effects may be unbalanced
El resultado de aov no nos da muchos detalles
Analizar el resultado
Para saber si las diferencias son significativas usamos la función summary()
            Df Sum Sq Mean Sq F value   Pr(>F)
grupos       2  91.95   45.98   12.98 0.000112 ***
Residuals   27  95.65    3.54
---
Signif. codes:  0 '***' 0.001 '**' 0.01 '*' 0.05 '.' 0.1 ' ' 1
Aún así, no nos dice que grupos son los que difieren entre sí.
ANOVA + Test de Tukey
Se usa el test de Tukey para ver las diferencias entre los grupos
  Tukey multiple comparisons of means
    95% family-wise confidence level

Fit: aov(formula = medidas ~ grupos, data = data)

$grupos
                  diff        lwr        upr     p adj
second-first -4.260538 -6.3475057 -2.1735696 0.0000746
third-first  -2.553259 -4.6402266 -0.4662905 0.0141790
third-second  1.707279 -0.3796889  3.7942472 0.1246936
El resultado de aov no nos da muchos detalles
ANOVA: leed la documentación ?aov
- Con las pruebas estadísticas, es particularmente importante leer y comprender la documentación de cada función que se utiliza
- Es posible que hagan algunas cosas complicadas con las opciones, y deberíais estar seguros de que hacen lo que queréis
- Los comportamientos predeterminados pueden cambiar (con, por ejemplo, el tamaño de la muestra)
Vamos a practicar
- Ejercicios de clase
Ejercicios de casa (Homeworks)
- En la web de la asignatura (enlace en Moodle)
- Entregar antes de la siguiente clase