Modelos Generalizados de Disimilitud en R
Generalized Dissimilarity Models (GDM)
Universidad de Córdoba (España)
Preparando los datos
Usaremos el paquete gdm. Éste tiene una forma particular de funcionar y especificar los datos. Así que necesitamos prepararlos un poco antes de empezar
Cargamos los datos de Wilson, incluyendo las coordenadas geográficas
library(openxlsx)
env <- read.xlsx("data/Wilson_Latorre/Data_multi_env_R_course.xlsx",
                 sheet = 1,
                 rowNames = TRUE)
com <- read.xlsx("data/Wilson_Latorre/Data_multi_bio_R_course.xlsx",
                 sheet = 1,
                 rowNames = TRUE)
coords <- read.xlsx("data/Wilson_Latorre/Data_multi_site_R_course.xlsx",
                    sheet = 1,
                    rowNames = TRUE)
summary(coords)
Sitio Parcela Estacion Año
Length:64 Min. :1.00 Length:64 Min. :20.00
Class :character 1st Qu.:1.75 Class :character 1st Qu.:20.75
Mode :character Median :2.50 Mode :character Median :21.00
Mean :2.50 Mean :21.00
3rd Qu.:3.25 3rd Qu.:21.25
Max. :4.00 Max. :22.00
Long Lat
Min. :-80.39 Min. :-1.292
1st Qu.:-80.34 1st Qu.:-1.266
Median :-80.32 Median :-1.240
Mean :-80.33 Mean :-1.236
3rd Qu.:-80.31 3rd Qu.:-1.211
Max. :-80.29 Max. :-1.173 Cargamos los datos bioclimáticos y los incorporamos a las variables ambientales
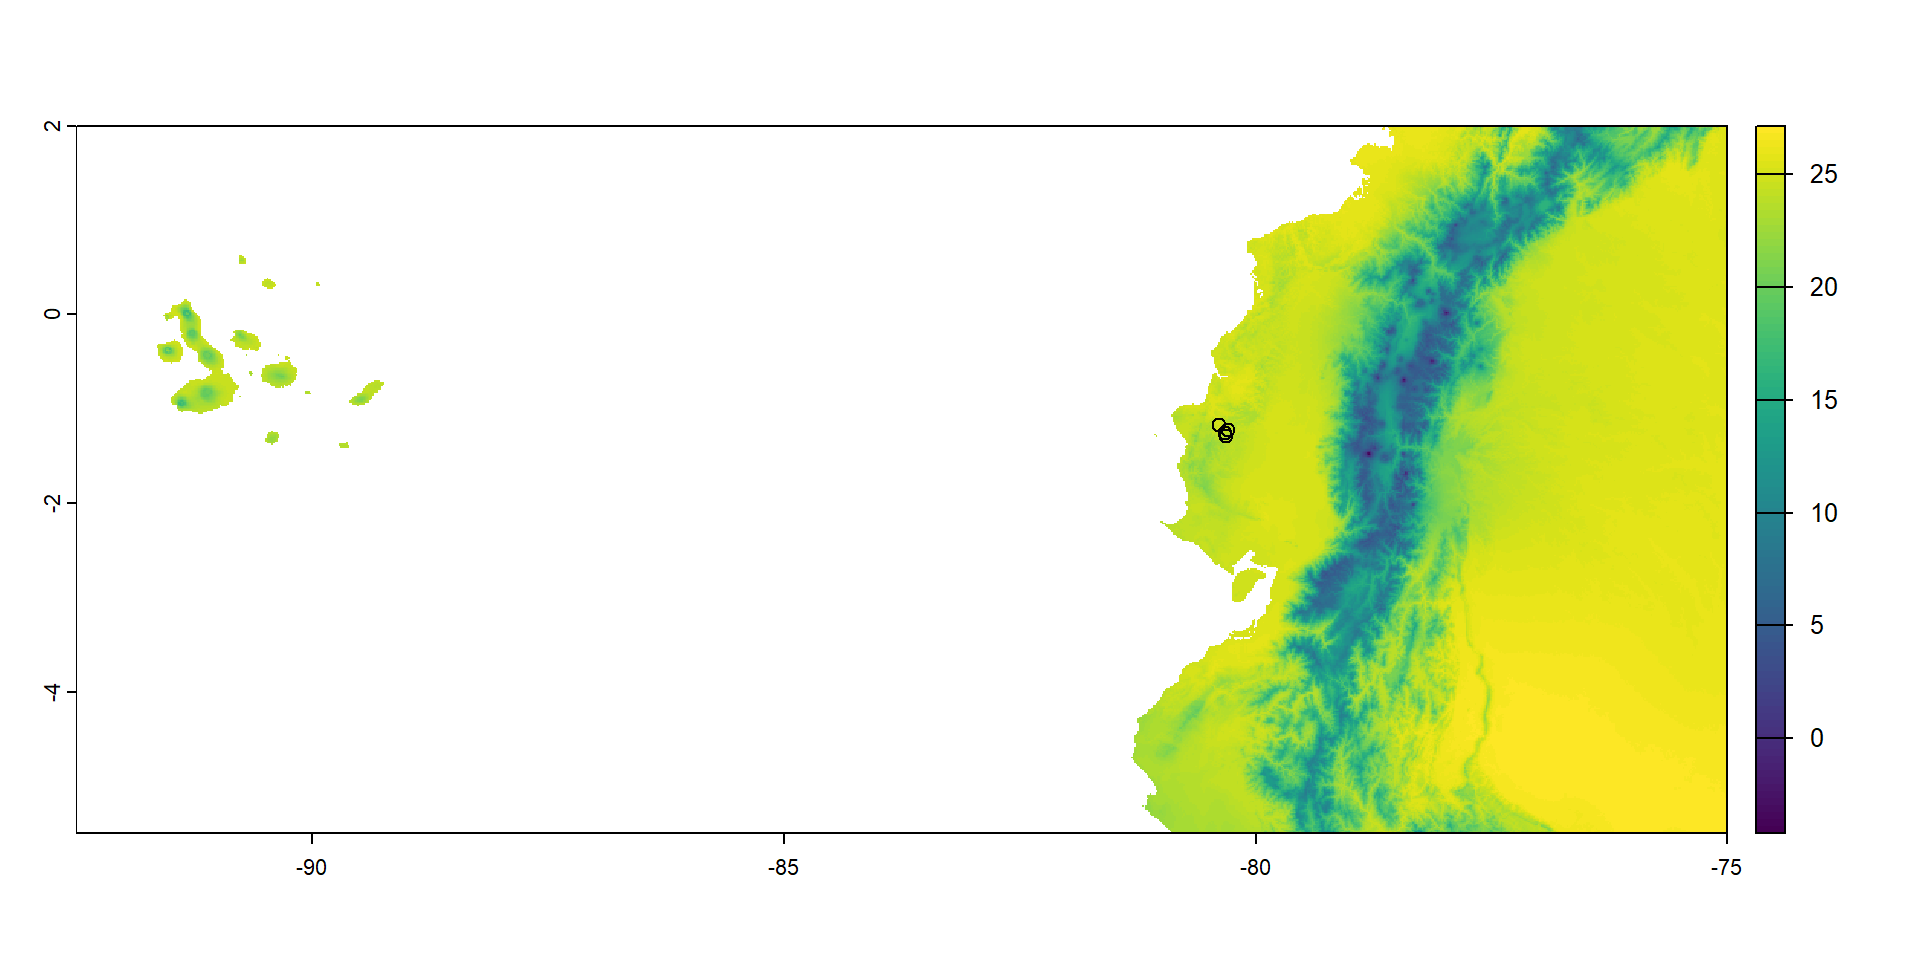
En particular cargamos los datos de Ecuador en formato ráster
Note
Estos datos aprendimos a generarlos durante la clase sobre datos espaciales en R.
Reproyectamos los mapas
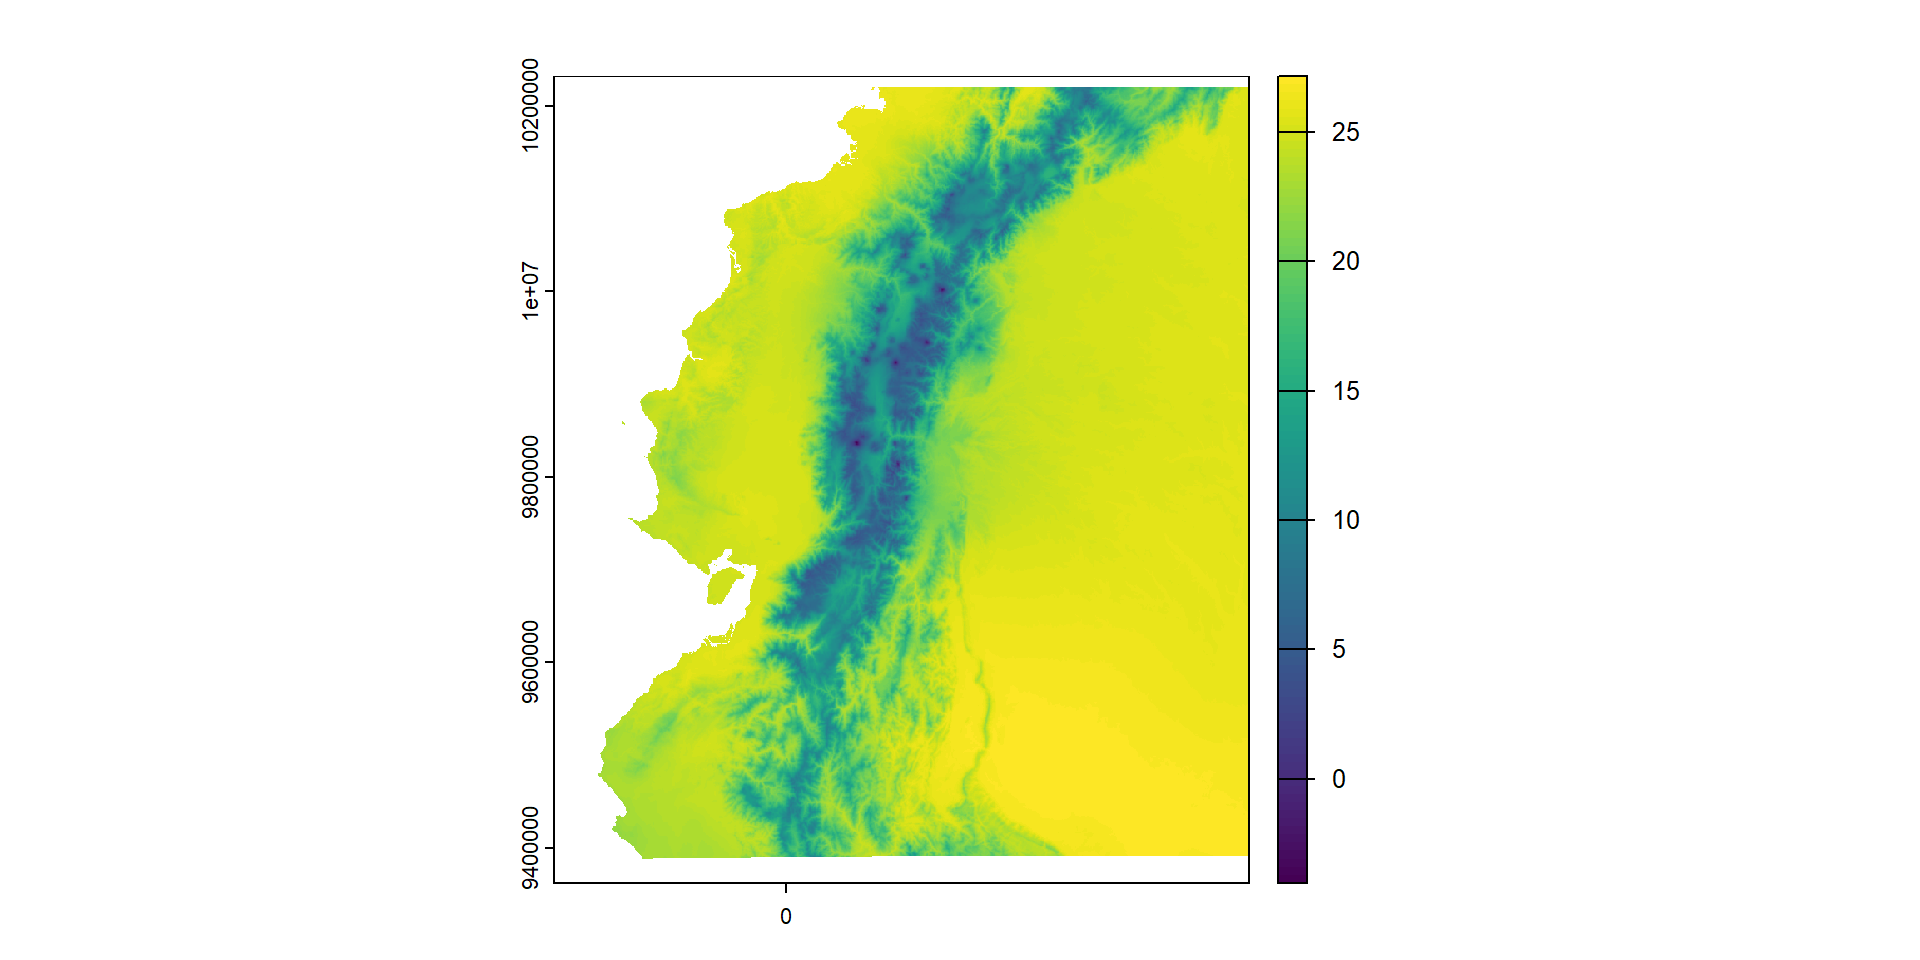
En UTM 18s y los recorto para la región de interés
Reproyecto los datos de coordenadas a UTM 18s y los combino con los datos de comunidades
Important
El paquete gdm requiere que las coordenadas estén especificadas como columnas en la matriz de comunidades, en la matriz de variables ambientales, o en las dos; pero no se pueden especificar como un objeto independiente.
Sitio Acanthagrion Alluaudomyia Anchytarsus Aquarius Axarus Brechmorhoga
1 BA1_SU20 11 0 0 0 0 0
2 BA1_SU21 1 0 0 0 0 0
3 BA1_WI21 0 0 0 0 0 0
4 BA1_WI22 0 0 0 0 0 0
5 BA2_SU20 6 0 0 0 0 0
6 BA2_SU21 0 0 0 0 0 0
Buenoa Charmatometra Cylloepus Erythemis Eurygerris Halobatopsis Hebrus
1 50 0 0 0 0 0 0
2 0 0 0 0 1 0 0
3 0 0 0 0 2 1 0
4 0 0 0 0 0 0 0
5 19 0 0 0 0 0 0
6 0 0 1 0 4 0 10
Helochares Hetaerina Heterelmis Hexatoma Husseyella Hydrometra Hydroscapha
1 0 1 0 0 0 0 0
2 0 2 0 0 22 0 0
3 0 0 0 0 19 0 0
4 0 0 0 0 12 0 0
5 0 3 0 0 0 0 0
6 0 0 1 0 6 0 0
Laccodytes Leptohyphes Leptonema Limnocoris Limnogonus Macrogynoplax
1 46 1 1 3 0 1
2 28 0 0 2 2 0
3 13 8 0 0 0 0
4 0 0 0 0 0 0
5 70 0 1 3 0 0
6 79 1 0 0 1 0
Macrothemis Mesovelia Microvelia Paracloeodes Pelocoris Phyllogomphoides
1 0 0 0 0 5 4
2 0 0 6 0 2 1
3 0 0 7 0 0 0
4 0 0 0 0 0 0
5 0 0 0 0 1 0
6 0 2 0 0 0 0
Phylloicus Rhagovelia Scirtes Simulium Stridulivelia Telmatometra
1 11 32 0 0 0 0
2 3 63 1 0 73 0
3 7 33 0 0 0 0
4 0 7 0 0 0 0
5 9 0 0 0 0 0
6 5 16 0 0 10 0
Telmatometroides Thraulodes Tipula Tricorythodes Melanoides Lymnaea Pomacea
1 0 26 0 1 0 0 0
2 0 6 0 2 0 0 0
3 0 3 0 2 0 0 0
4 0 0 0 0 0 0 0
5 0 56 0 5 0 0 0
6 0 7 0 0 0 0 0
Pseudothelphusidae Hyalella x y
1 0 0 -91852.58 9856630
2 0 0 -91852.58 9856630
3 0 0 -91852.58 9856630
4 0 0 -91852.58 9856630
5 3 0 -91852.58 9856630
6 0 0 -91852.58 9856630Genero un identificador de sitio común para la matriz de comunidades y la de variables ambientales
N-NO3- N-NH3 N-NO2- PO43- pH DO EC NTU T°C
SC1_SU20 0.02 0.09 0.003 1.20 9.165 1.840 489.0 8.10 22.180
SC2_SU20 0.02 0.10 0.003 1.12 9.230 1.860 489.0 8.55 22.495
SC3_SU20 0.02 0.13 0.005 3.86 9.115 1.905 472.0 7.70 23.035
SC4_SU20 0.02 0.18 0.003 4.09 8.745 1.985 483.5 8.15 22.445
BA1_SU20 0.05 0.03 0.006 0.73 8.200 5.950 441.5 11.40 19.300
BA2_SU20 0.04 0.10 0.005 0.72 8.940 5.950 166.5 11.85 19.945
Current.velocity Average.depth Average.width wc2.1_30s_bio_1
SC1_SU20 0.3454020 0.055 0.300 23.84583
SC2_SU20 0.1731571 0.055 0.400 23.84583
SC3_SU20 0.1848344 0.050 0.825 23.84583
SC4_SU20 0.4827096 0.025 0.130 23.84583
BA1_SU20 0.2882227 0.065 0.140 23.89167
BA2_SU20 0.2490695 0.025 0.255 23.89167
wc2.1_30s_bio_2 wc2.1_30s_bio_3 wc2.1_30s_bio_4 wc2.1_30s_bio_5
SC1_SU20 9.391666 76.98088 91.21548 29.8
SC2_SU20 9.391666 76.98088 91.21548 29.8
SC3_SU20 9.391666 76.98088 91.21548 29.8
SC4_SU20 9.391666 76.98088 91.21548 29.8
BA1_SU20 9.466667 76.34409 101.59706 29.9
BA2_SU20 9.466667 76.34409 101.59706 29.9
wc2.1_30s_bio_6 wc2.1_30s_bio_7 wc2.1_30s_bio_8 wc2.1_30s_bio_9
SC1_SU20 17.6 12.2 24.85000 22.93333
SC2_SU20 17.6 12.2 24.85000 22.93333
SC3_SU20 17.6 12.2 24.85000 22.93333
SC4_SU20 17.6 12.2 24.85000 22.93333
BA1_SU20 17.5 12.4 25.18333 22.85000
BA2_SU20 17.5 12.4 25.18333 22.85000
wc2.1_30s_bio_10 wc2.1_30s_bio_11 wc2.1_30s_bio_12 wc2.1_30s_bio_13
SC1_SU20 25.01667 22.83333 1079 279
SC2_SU20 25.01667 22.83333 1079 279
SC3_SU20 25.01667 22.83333 1079 279
SC4_SU20 25.01667 22.83333 1079 279
BA1_SU20 25.18333 22.73333 1119 291
BA2_SU20 25.18333 22.73333 1119 291
wc2.1_30s_bio_14 wc2.1_30s_bio_15 wc2.1_30s_bio_16 wc2.1_30s_bio_17
SC1_SU20 6 108.9202 685 22
SC2_SU20 6 108.9202 685 22
SC3_SU20 6 108.9202 685 22
SC4_SU20 6 108.9202 685 22
BA1_SU20 5 108.7879 705 22
BA2_SU20 5 108.7879 705 22
wc2.1_30s_bio_18 wc2.1_30s_bio_19 site_id
SC1_SU20 682 25 1
SC2_SU20 682 25 2
SC3_SU20 682 25 3
SC4_SU20 682 25 4
BA1_SU20 705 25 5
BA2_SU20 705 25 6Calibrando modelos GDM
Usamos el paquete gdm
Creamos la tabla de disimilaridades
library(gdm)
gdmTab <- formatsitepair(com[,-1], # Quito la columna `Sitio`
bioFormat = 1,
abundance = TRUE,
XColumn = "x", # Nombre de la coordenada X
YColumn = "y", # Nombre de la coordenada Y
siteColumn = "site_id", # Nombre del identificador
predData = env) # Quito columnas de texto
gdmRast <- formatsitepair(com[,-1],
bioFormat = 1,
abundance = TRUE,
XColumn = "x",
YColumn = "y",
siteColumn = "site_id",
predData = bio)
head(gdmTab) distance weights s1.xCoord s1.yCoord s2.xCoord s2.yCoord s1.N-NO3-
SC1_SU20 0.6225490 1 -91852.58 9856630 -91852.58 9856630 0.02
SC1_SU20.1 0.6041667 1 -91852.58 9856630 -91852.58 9856630 0.02
SC1_SU20.2 0.9339623 1 -91852.58 9856630 -91852.58 9856630 0.02
SC1_SU20.3 0.3875339 1 -91852.58 9856630 -91852.58 9856630 0.02
SC1_SU20.4 0.5535714 1 -91852.58 9856630 -91852.58 9856630 0.02
SC1_SU20.5 0.7301038 1 -91852.58 9856630 -91852.58 9856630 0.02
s1.N-NH3 s1.N-NO2- s1.PO43- s1.pH s1.DO s1.EC s1.NTU s1.T°C
SC1_SU20 0.09 0.003 1.2 9.165 1.84 489 8.1 22.18
SC1_SU20.1 0.09 0.003 1.2 9.165 1.84 489 8.1 22.18
SC1_SU20.2 0.09 0.003 1.2 9.165 1.84 489 8.1 22.18
SC1_SU20.3 0.09 0.003 1.2 9.165 1.84 489 8.1 22.18
SC1_SU20.4 0.09 0.003 1.2 9.165 1.84 489 8.1 22.18
SC1_SU20.5 0.09 0.003 1.2 9.165 1.84 489 8.1 22.18
s1.Current.velocity s1.Average.depth s1.Average.width
SC1_SU20 0.345402 0.055 0.3
SC1_SU20.1 0.345402 0.055 0.3
SC1_SU20.2 0.345402 0.055 0.3
SC1_SU20.3 0.345402 0.055 0.3
SC1_SU20.4 0.345402 0.055 0.3
SC1_SU20.5 0.345402 0.055 0.3
s1.wc2.1_30s_bio_1 s1.wc2.1_30s_bio_2 s1.wc2.1_30s_bio_3
SC1_SU20 23.84583 9.391666 76.98088
SC1_SU20.1 23.84583 9.391666 76.98088
SC1_SU20.2 23.84583 9.391666 76.98088
SC1_SU20.3 23.84583 9.391666 76.98088
SC1_SU20.4 23.84583 9.391666 76.98088
SC1_SU20.5 23.84583 9.391666 76.98088
s1.wc2.1_30s_bio_4 s1.wc2.1_30s_bio_5 s1.wc2.1_30s_bio_6
SC1_SU20 91.21548 29.8 17.6
SC1_SU20.1 91.21548 29.8 17.6
SC1_SU20.2 91.21548 29.8 17.6
SC1_SU20.3 91.21548 29.8 17.6
SC1_SU20.4 91.21548 29.8 17.6
SC1_SU20.5 91.21548 29.8 17.6
s1.wc2.1_30s_bio_7 s1.wc2.1_30s_bio_8 s1.wc2.1_30s_bio_9
SC1_SU20 12.2 24.85 22.93333
SC1_SU20.1 12.2 24.85 22.93333
SC1_SU20.2 12.2 24.85 22.93333
SC1_SU20.3 12.2 24.85 22.93333
SC1_SU20.4 12.2 24.85 22.93333
SC1_SU20.5 12.2 24.85 22.93333
s1.wc2.1_30s_bio_10 s1.wc2.1_30s_bio_11 s1.wc2.1_30s_bio_12
SC1_SU20 25.01667 22.83333 1079
SC1_SU20.1 25.01667 22.83333 1079
SC1_SU20.2 25.01667 22.83333 1079
SC1_SU20.3 25.01667 22.83333 1079
SC1_SU20.4 25.01667 22.83333 1079
SC1_SU20.5 25.01667 22.83333 1079
s1.wc2.1_30s_bio_13 s1.wc2.1_30s_bio_14 s1.wc2.1_30s_bio_15
SC1_SU20 279 6 108.9202
SC1_SU20.1 279 6 108.9202
SC1_SU20.2 279 6 108.9202
SC1_SU20.3 279 6 108.9202
SC1_SU20.4 279 6 108.9202
SC1_SU20.5 279 6 108.9202
s1.wc2.1_30s_bio_16 s1.wc2.1_30s_bio_17 s1.wc2.1_30s_bio_18
SC1_SU20 685 22 682
SC1_SU20.1 685 22 682
SC1_SU20.2 685 22 682
SC1_SU20.3 685 22 682
SC1_SU20.4 685 22 682
SC1_SU20.5 685 22 682
s1.wc2.1_30s_bio_19 s2.N-NO3- s2.N-NH3 s2.N-NO2- s2.PO43- s2.pH
SC1_SU20 25 0.02 0.10 0.003 1.12 9.230
SC1_SU20.1 25 0.02 0.13 0.005 3.86 9.115
SC1_SU20.2 25 0.02 0.18 0.003 4.09 8.745
SC1_SU20.3 25 0.05 0.03 0.006 0.73 8.200
SC1_SU20.4 25 0.04 0.10 0.005 0.72 8.940
SC1_SU20.5 25 0.05 0.09 0.004 0.57 8.895
s2.DO s2.EC s2.NTU s2.T°C s2.Current.velocity s2.Average.depth
SC1_SU20 1.860 489.0 8.55 22.495 0.1731571 0.0550
SC1_SU20.1 1.905 472.0 7.70 23.035 0.1848344 0.0500
SC1_SU20.2 1.985 483.5 8.15 22.445 0.4827096 0.0250
SC1_SU20.3 5.950 441.5 11.40 19.300 0.2882227 0.0650
SC1_SU20.4 5.950 166.5 11.85 19.945 0.2490695 0.0250
SC1_SU20.5 5.865 164.0 23.50 19.965 0.1663898 0.0225
s2.Average.width s2.wc2.1_30s_bio_1 s2.wc2.1_30s_bio_2
SC1_SU20 0.400 23.84583 9.391666
SC1_SU20.1 0.825 23.84583 9.391666
SC1_SU20.2 0.130 23.84583 9.391666
SC1_SU20.3 0.140 23.89167 9.466667
SC1_SU20.4 0.255 23.89167 9.466667
SC1_SU20.5 0.160 23.89167 9.466667
s2.wc2.1_30s_bio_3 s2.wc2.1_30s_bio_4 s2.wc2.1_30s_bio_5
SC1_SU20 76.98088 91.21548 29.8
SC1_SU20.1 76.98088 91.21548 29.8
SC1_SU20.2 76.98088 91.21548 29.8
SC1_SU20.3 76.34409 101.59706 29.9
SC1_SU20.4 76.34409 101.59706 29.9
SC1_SU20.5 76.34409 101.59706 29.9
s2.wc2.1_30s_bio_6 s2.wc2.1_30s_bio_7 s2.wc2.1_30s_bio_8
SC1_SU20 17.6 12.2 24.85000
SC1_SU20.1 17.6 12.2 24.85000
SC1_SU20.2 17.6 12.2 24.85000
SC1_SU20.3 17.5 12.4 25.18333
SC1_SU20.4 17.5 12.4 25.18333
SC1_SU20.5 17.5 12.4 25.18333
s2.wc2.1_30s_bio_9 s2.wc2.1_30s_bio_10 s2.wc2.1_30s_bio_11
SC1_SU20 22.93333 25.01667 22.83333
SC1_SU20.1 22.93333 25.01667 22.83333
SC1_SU20.2 22.93333 25.01667 22.83333
SC1_SU20.3 22.85000 25.18333 22.73333
SC1_SU20.4 22.85000 25.18333 22.73333
SC1_SU20.5 22.85000 25.18333 22.73333
s2.wc2.1_30s_bio_12 s2.wc2.1_30s_bio_13 s2.wc2.1_30s_bio_14
SC1_SU20 1079 279 6
SC1_SU20.1 1079 279 6
SC1_SU20.2 1079 279 6
SC1_SU20.3 1119 291 5
SC1_SU20.4 1119 291 5
SC1_SU20.5 1119 291 5
s2.wc2.1_30s_bio_15 s2.wc2.1_30s_bio_16 s2.wc2.1_30s_bio_17
SC1_SU20 108.9202 685 22
SC1_SU20.1 108.9202 685 22
SC1_SU20.2 108.9202 685 22
SC1_SU20.3 108.7879 705 22
SC1_SU20.4 108.7879 705 22
SC1_SU20.5 108.7879 705 22
s2.wc2.1_30s_bio_18 s2.wc2.1_30s_bio_19
SC1_SU20 682 25
SC1_SU20.1 682 25
SC1_SU20.2 682 25
SC1_SU20.3 705 25
SC1_SU20.4 705 25
SC1_SU20.5 705 25Calibramos los modelos
Analicemos los resultados
Veamos los resultados de los datos de Wilson
[1]
[1]
[1] GDM Modelling Summary
[1] Creation Date: Thu Oct 9 13:50:52 2025
[1]
[1] Name: gdmTab.fit
[1]
[1] Data: gdmTab
[1]
[1] Samples: 2016
[1]
[1] Geographical distance used in model fitting? TRUE
[1]
[1] NULL Deviance: 399.729
[1] GDM Deviance: 335.395
[1] Percent Deviance Explained: 16.094
[1]
[1] Intercept: 0.848
[1]
[1] PREDICTOR ORDER BY SUM OF I-SPLINE COEFFICIENTS:
[1]
[1] Predictor 1: T°C
[1] Splines: 3
[1] Min Knot: 19.3
[1] 50% Knot: 21.502
[1] Max Knot: 23.32
[1] Coefficient[1]: 0.625
[1] Coefficient[2]: 0
[1] Coefficient[3]: 0
[1] Sum of coefficients for T°C: 0.625
[1]
[1] Predictor 2: Geographic
[1] Splines: 3
[1] Min Knot: 0
[1] 50% Knot: 7872.39
[1] Max Knot: 15526.336
[1] Coefficient[1]: 0.446
[1] Coefficient[2]: 0
[1] Coefficient[3]: 0
[1] Sum of coefficients for Geographic: 0.446
[1]
[1] Predictor 3: DO
[1] Splines: 3
[1] Min Knot: 1.68
[1] 50% Knot: 5.578
[1] Max Knot: 7.785
[1] Coefficient[1]: 0.32
[1] Coefficient[2]: 0
[1] Coefficient[3]: 0
[1] Sum of coefficients for DO: 0.32
[1]
[1] Predictor 4: PO43-
[1] Splines: 3
[1] Min Knot: 0.16
[1] 50% Knot: 0.67
[1] Max Knot: 4.09
[1] Coefficient[1]: 0.264
[1] Coefficient[2]: 0
[1] Coefficient[3]: 0
[1] Sum of coefficients for PO43-: 0.264
[1]
[1] Predictor 5: N-NO3-
[1] Splines: 3
[1] Min Knot: 0.01
[1] 50% Knot: 0.05
[1] Max Knot: 0.39
[1] Coefficient[1]: 0
[1] Coefficient[2]: 0
[1] Coefficient[3]: 0.153
[1] Sum of coefficients for N-NO3-: 0.153
[1]
[1] Predictor 6: N-NO2-
[1] Splines: 3
[1] Min Knot: 0.001
[1] 50% Knot: 0.005
[1] Max Knot: 0.017
[1] Coefficient[1]: 0.152
[1] Coefficient[2]: 0
[1] Coefficient[3]: 0
[1] Sum of coefficients for N-NO2-: 0.152
[1]
[1] Predictor 7: NTU
[1] Splines: 3
[1] Min Knot: 2.75
[1] 50% Knot: 14.9
[1] Max Knot: 128.5
[1] Coefficient[1]: 0
[1] Coefficient[2]: 0
[1] Coefficient[3]: 0.141
[1] Sum of coefficients for NTU: 0.141
[1]
[1] Predictor 8: N-NH3
[1] Splines: 3
[1] Min Knot: 0.008
[1] 50% Knot: 0.1
[1] Max Knot: 0.18
[1] Coefficient[1]: 0
[1] Coefficient[2]: 0
[1] Coefficient[3]: 0
[1] Sum of coefficients for N-NH3: 0
[1]
[1] Predictor 9: pH
[1] Splines: 3
[1] Min Knot: 7.33
[1] 50% Knot: 8.265
[1] Max Knot: 9.23
[1] Coefficient[1]: 0
[1] Coefficient[2]: 0
[1] Coefficient[3]: 0
[1] Sum of coefficients for pH: 0
[1]
[1] Predictor 10: EC
[1] Splines: 3
[1] Min Knot: 117
[1] 50% Knot: 394.25
[1] Max Knot: 1641
[1] Coefficient[1]: 0
[1] Coefficient[2]: 0
[1] Coefficient[3]: 0
[1] Sum of coefficients for EC: 0
[1]
[1] Predictor 11: Current.velocity
[1] Splines: 3
[1] Min Knot: 0.117
[1] 50% Knot: 0.425
[1] Max Knot: 76.452
[1] Coefficient[1]: 0
[1] Coefficient[2]: 0
[1] Coefficient[3]: 0
[1] Sum of coefficients for Current.velocity: 0
[1]
[1] Predictor 12: Average.depth
[1] Splines: 3
[1] Min Knot: 0.007
[1] 50% Knot: 0.038
[1] Max Knot: 0.155
[1] Coefficient[1]: 0
[1] Coefficient[2]: 0
[1] Coefficient[3]: 0
[1] Sum of coefficients for Average.depth: 0
[1]
[1] Predictor 13: Average.width
[1] Splines: 3
[1] Min Knot: 0.13
[1] 50% Knot: 0.51
[1] Max Knot: 4.75
[1] Coefficient[1]: 0
[1] Coefficient[2]: 0
[1] Coefficient[3]: 0
[1] Sum of coefficients for Average.width: 0
[1]
[1] Predictor 14: wc2.1_30s_bio_1
[1] Splines: 3
[1] Min Knot: 23.846
[1] 50% Knot: 24.129
[1] Max Knot: 25.142
[1] Coefficient[1]: 0
[1] Coefficient[2]: 0
[1] Coefficient[3]: 0
[1] Sum of coefficients for wc2.1_30s_bio_1: 0
[1]
[1] Predictor 15: wc2.1_30s_bio_2
[1] Splines: 3
[1] Min Knot: 9.392
[1] 50% Knot: 9.55
[1] Max Knot: 10.067
[1] Coefficient[1]: 0
[1] Coefficient[2]: 0
[1] Coefficient[3]: 0
[1] Sum of coefficients for wc2.1_30s_bio_2: 0
[1]
[1] Predictor 16: wc2.1_30s_bio_3
[1] Splines: 3
[1] Min Knot: 76.344
[1] 50% Knot: 77.024
[1] Max Knot: 80.533
[1] Coefficient[1]: 0
[1] Coefficient[2]: 0
[1] Coefficient[3]: 0
[1] Sum of coefficients for wc2.1_30s_bio_3: 0
[1]
[1] Predictor 17: wc2.1_30s_bio_4
[1] Splines: 3
[1] Min Knot: 77.777
[1] 50% Knot: 93.404
[1] Max Knot: 101.597
[1] Coefficient[1]: 0
[1] Coefficient[2]: 0
[1] Coefficient[3]: 0
[1] Sum of coefficients for wc2.1_30s_bio_4: 0
[1]
[1] Predictor 18: wc2.1_30s_bio_5
[1] Splines: 3
[1] Min Knot: 29.8
[1] 50% Knot: 30.2
[1] Max Knot: 31.2
[1] Coefficient[1]: 0
[1] Coefficient[2]: 0
[1] Coefficient[3]: 0
[1] Sum of coefficients for wc2.1_30s_bio_5: 0
[1]
[1] Predictor 19: wc2.1_30s_bio_6
[1] Splines: 3
[1] Min Knot: 17.5
[1] 50% Knot: 17.8
[1] Max Knot: 18.7
[1] Coefficient[1]: 0
[1] Coefficient[2]: 0
[1] Coefficient[3]: 0
[1] Sum of coefficients for wc2.1_30s_bio_6: 0
[1]
[1] Predictor 20: wc2.1_30s_bio_7
[1] Splines: 3
[1] Min Knot: 12.2
[1] 50% Knot: 12.45
[1] Max Knot: 12.5
[1] Coefficient[1]: 0
[1] Coefficient[2]: 0
[1] Coefficient[3]: 0
[1] Sum of coefficients for wc2.1_30s_bio_7: 0
[1]
[1] Predictor 21: wc2.1_30s_bio_8
[1] Splines: 3
[1] Min Knot: 24.85
[1] 50% Knot: 25.317
[1] Max Knot: 26.017
[1] Coefficient[1]: 0
[1] Coefficient[2]: 0
[1] Coefficient[3]: 0
[1] Sum of coefficients for wc2.1_30s_bio_8: 0
[1]
[1] Predictor 22: wc2.1_30s_bio_9
[1] Splines: 3
[1] Min Knot: 22.85
[1] 50% Knot: 23.158
[1] Max Knot: 24.317
[1] Coefficient[1]: 0
[1] Coefficient[2]: 0
[1] Coefficient[3]: 0
[1] Sum of coefficients for wc2.1_30s_bio_9: 0
[1]
[1] Predictor 23: wc2.1_30s_bio_10
[1] Splines: 3
[1] Min Knot: 25.017
[1] 50% Knot: 25.4
[1] Max Knot: 26.15
[1] Coefficient[1]: 0
[1] Coefficient[2]: 0
[1] Coefficient[3]: 0
[1] Sum of coefficients for wc2.1_30s_bio_10: 0
[1]
[1] Predictor 24: wc2.1_30s_bio_11
[1] Splines: 3
[1] Min Knot: 22.733
[1] 50% Knot: 23.067
[1] Max Knot: 24.3
[1] Coefficient[1]: 0
[1] Coefficient[2]: 0
[1] Coefficient[3]: 0
[1] Sum of coefficients for wc2.1_30s_bio_11: 0
[1]
[1] Predictor 25: wc2.1_30s_bio_12
[1] Splines: 3
[1] Min Knot: 729
[1] 50% Knot: 1047.5
[1] Max Knot: 1119
[1] Coefficient[1]: 0
[1] Coefficient[2]: 0
[1] Coefficient[3]: 0
[1] Sum of coefficients for wc2.1_30s_bio_12: 0
[1]
[1] Predictor 26: wc2.1_30s_bio_13
[1] Splines: 3
[1] Min Knot: 185
[1] 50% Knot: 272
[1] Max Knot: 291
[1] Coefficient[1]: 0
[1] Coefficient[2]: 0
[1] Coefficient[3]: 0
[1] Sum of coefficients for wc2.1_30s_bio_13: 0
[1]
[1] Predictor 27: wc2.1_30s_bio_14
[1] Splines: 3
[1] Min Knot: 4
[1] 50% Knot: 5
[1] Max Knot: 6
[1] Coefficient[1]: 0
[1] Coefficient[2]: 0
[1] Coefficient[3]: 0
[1] Sum of coefficients for wc2.1_30s_bio_14: 0
[1]
[1] Predictor 28: wc2.1_30s_bio_15
[1] Splines: 3
[1] Min Knot: 106.429
[1] 50% Knot: 108.818
[1] Max Knot: 108.92
[1] Coefficient[1]: 0
[1] Coefficient[2]: 0
[1] Coefficient[3]: 0
[1] Sum of coefficients for wc2.1_30s_bio_15: 0
[1]
[1] Predictor 29: wc2.1_30s_bio_16
[1] Splines: 3
[1] Min Knot: 466
[1] 50% Knot: 664.5
[1] Max Knot: 705
[1] Coefficient[1]: 0
[1] Coefficient[2]: 0
[1] Coefficient[3]: 0
[1] Sum of coefficients for wc2.1_30s_bio_16: 0
[1]
[1] Predictor 30: wc2.1_30s_bio_17
[1] Splines: 3
[1] Min Knot: 20
[1] 50% Knot: 21
[1] Max Knot: 22
[1] Coefficient[1]: 0
[1] Coefficient[2]: 0
[1] Coefficient[3]: 0
[1] Sum of coefficients for wc2.1_30s_bio_17: 0
[1]
[1] Predictor 31: wc2.1_30s_bio_18
[1] Splines: 3
[1] Min Knot: 455
[1] 50% Knot: 660.5
[1] Max Knot: 705
[1] Coefficient[1]: 0
[1] Coefficient[2]: 0
[1] Coefficient[3]: 0
[1] Sum of coefficients for wc2.1_30s_bio_18: 0
[1]
[1] Predictor 32: wc2.1_30s_bio_19
[1] Splines: 3
[1] Min Knot: 22
[1] 50% Knot: 24
[1] Max Knot: 25
[1] Coefficient[1]: 0
[1] Coefficient[2]: 0
[1] Coefficient[3]: 0
[1] Sum of coefficients for wc2.1_30s_bio_19: 0… y los del modelo calibrado con variables bioclimáticas
[1]
[1]
[1] GDM Modelling Summary
[1] Creation Date: Thu Oct 9 13:50:52 2025
[1]
[1] Name: gdmRast.fit
[1]
[1] Data: gdmRast
[1]
[1] Samples: 6
[1]
[1] Geographical distance used in model fitting? TRUE
[1]
[1] NULL Deviance: 0.236
[1] GDM Deviance: 0.001
[1] Percent Deviance Explained: 99.787
[1]
[1] Intercept: 0.4
[1]
[1] PREDICTOR ORDER BY SUM OF I-SPLINE COEFFICIENTS:
[1]
[1] Predictor 1: wc2.1_30s_bio_15
[1] Splines: 3
[1] Min Knot: 107.465
[1] 50% Knot: 107.929
[1] Max Knot: 108.893
[1] Coefficient[1]: 0
[1] Coefficient[2]: 0.194
[1] Coefficient[3]: 0.442
[1] Sum of coefficients for wc2.1_30s_bio_15: 0.636
[1]
[1] Predictor 2: wc2.1_30s_bio_3
[1] Splines: 3
[1] Min Knot: 76.518
[1] 50% Knot: 77.126
[1] Max Knot: 80.69
[1] Coefficient[1]: 0
[1] Coefficient[2]: 0.371
[1] Coefficient[3]: 0
[1] Sum of coefficients for wc2.1_30s_bio_3: 0.371
[1]
[1] Predictor 3: wc2.1_30s_bio_2
[1] Splines: 3
[1] Min Knot: 9.367
[1] 50% Knot: 9.467
[1] Max Knot: 10.086
[1] Coefficient[1]: 0
[1] Coefficient[2]: 0.216
[1] Coefficient[3]: 0
[1] Sum of coefficients for wc2.1_30s_bio_2: 0.216
[1]
[1] Predictor 4: Geographic
[1] Splines: 3
[1] Min Knot: 3876.728
[1] 50% Knot: 9755.3
[1] Max Knot: 15160.988
[1] Coefficient[1]: 0
[1] Coefficient[2]: 0
[1] Coefficient[3]: 0
[1] Sum of coefficients for Geographic: 0
[1]
[1] Predictor 5: wc2.1_30s_bio_1
[1] Splines: 3
[1] Min Knot: 23.511
[1] 50% Knot: 24
[1] Max Knot: 25.153
[1] Coefficient[1]: 0
[1] Coefficient[2]: 0
[1] Coefficient[3]: 0
[1] Sum of coefficients for wc2.1_30s_bio_1: 0
[1]
[1] Predictor 6: wc2.1_30s_bio_4
[1] Splines: 3
[1] Min Knot: 77.422
[1] 50% Knot: 94.264
[1] Max Knot: 94.981
[1] Coefficient[1]: 0
[1] Coefficient[2]: 0
[1] Coefficient[3]: 0
[1] Sum of coefficients for wc2.1_30s_bio_4: 0
[1]
[1] Predictor 7: wc2.1_30s_bio_5
[1] Splines: 3
[1] Min Knot: 29.346
[1] 50% Knot: 30.011
[1] Max Knot: 31.223
[1] Coefficient[1]: 0
[1] Coefficient[2]: 0
[1] Coefficient[3]: 0
[1] Sum of coefficients for wc2.1_30s_bio_5: 0
[1]
[1] Predictor 8: wc2.1_30s_bio_6
[1] Splines: 3
[1] Min Knot: 17.212
[1] 50% Knot: 17.681
[1] Max Knot: 18.723
[1] Coefficient[1]: 0
[1] Coefficient[2]: 0
[1] Coefficient[3]: 0
[1] Sum of coefficients for wc2.1_30s_bio_6: 0
[1]
[1] Predictor 9: wc2.1_30s_bio_7
[1] Splines: 3
[1] Min Knot: 12.134
[1] 50% Knot: 12.33
[1] Max Knot: 12.5
[1] Coefficient[1]: 0
[1] Coefficient[2]: 0
[1] Coefficient[3]: 0
[1] Sum of coefficients for wc2.1_30s_bio_7: 0
[1]
[1] Predictor 10: wc2.1_30s_bio_8
[1] Splines: 3
[1] Min Knot: 24.721
[1] 50% Knot: 25.048
[1] Max Knot: 26.017
[1] Coefficient[1]: 0
[1] Coefficient[2]: 0
[1] Coefficient[3]: 0
[1] Sum of coefficients for wc2.1_30s_bio_8: 0
[1]
[1] Predictor 11: wc2.1_30s_bio_9
[1] Splines: 3
[1] Min Knot: 22.556
[1] 50% Knot: 23.05
[1] Max Knot: 24.346
[1] Coefficient[1]: 0
[1] Coefficient[2]: 0
[1] Coefficient[3]: 0
[1] Sum of coefficients for wc2.1_30s_bio_9: 0
[1]
[1] Predictor 12: wc2.1_30s_bio_10
[1] Splines: 3
[1] Min Knot: 24.721
[1] 50% Knot: 25.214
[1] Max Knot: 26.154
[1] Coefficient[1]: 0
[1] Coefficient[2]: 0
[1] Coefficient[3]: 0
[1] Sum of coefficients for wc2.1_30s_bio_10: 0
[1]
[1] Predictor 13: wc2.1_30s_bio_11
[1] Splines: 3
[1] Min Knot: 22.429
[1] 50% Knot: 22.937
[1] Max Knot: 24.315
[1] Coefficient[1]: 0
[1] Coefficient[2]: 0
[1] Coefficient[3]: 0
[1] Sum of coefficients for wc2.1_30s_bio_11: 0
[1]
[1] Predictor 14: wc2.1_30s_bio_12
[1] Splines: 3
[1] Min Knot: 737.524
[1] 50% Knot: 1074.711
[1] Max Knot: 1127.775
[1] Coefficient[1]: 0
[1] Coefficient[2]: 0
[1] Coefficient[3]: 0
[1] Sum of coefficients for wc2.1_30s_bio_12: 0
[1]
[1] Predictor 15: wc2.1_30s_bio_13
[1] Splines: 3
[1] Min Knot: 188.851
[1] 50% Knot: 278.278
[1] Max Knot: 289.219
[1] Coefficient[1]: 0
[1] Coefficient[2]: 0
[1] Coefficient[3]: 0
[1] Sum of coefficients for wc2.1_30s_bio_13: 0
[1]
[1] Predictor 16: wc2.1_30s_bio_14
[1] Splines: 3
[1] Min Knot: 4.362
[1] 50% Knot: 5.397
[1] Max Knot: 6.437
[1] Coefficient[1]: 0
[1] Coefficient[2]: 0
[1] Coefficient[3]: 0
[1] Sum of coefficients for wc2.1_30s_bio_14: 0
[1]
[1] Predictor 17: wc2.1_30s_bio_16
[1] Splines: 3
[1] Min Knot: 473.697
[1] 50% Knot: 679.284
[1] Max Knot: 707.998
[1] Coefficient[1]: 0
[1] Coefficient[2]: 0
[1] Coefficient[3]: 0
[1] Sum of coefficients for wc2.1_30s_bio_16: 0
[1]
[1] Predictor 18: wc2.1_30s_bio_17
[1] Splines: 3
[1] Min Knot: 18.49
[1] 50% Knot: 22.089
[1] Max Knot: 25.186
[1] Coefficient[1]: 0
[1] Coefficient[2]: 0
[1] Coefficient[3]: 0
[1] Sum of coefficients for wc2.1_30s_bio_17: 0
[1]
[1] Predictor 19: wc2.1_30s_bio_18
[1] Splines: 3
[1] Min Knot: 463.568
[1] 50% Knot: 676.69
[1] Max Knot: 707.998
[1] Coefficient[1]: 0
[1] Coefficient[2]: 0
[1] Coefficient[3]: 0
[1] Sum of coefficients for wc2.1_30s_bio_18: 0
[1]
[1] Predictor 20: wc2.1_30s_bio_19
[1] Splines: 3
[1] Min Knot: 20.49
[1] 50% Knot: 25.411
[1] Max Knot: 29.948
[1] Coefficient[1]: 0
[1] Coefficient[2]: 0
[1] Coefficient[3]: 0
[1] Sum of coefficients for wc2.1_30s_bio_19: 0Important
Fijaros como el modelo explica un 80% de la desvianza de los datos. Pero tiene un poco de truco, ya que este modelo solo contempla el río como unidad de muestreo, al caer las 3 parcelas (desembocadura, norte y sur) en el mismo pixel.
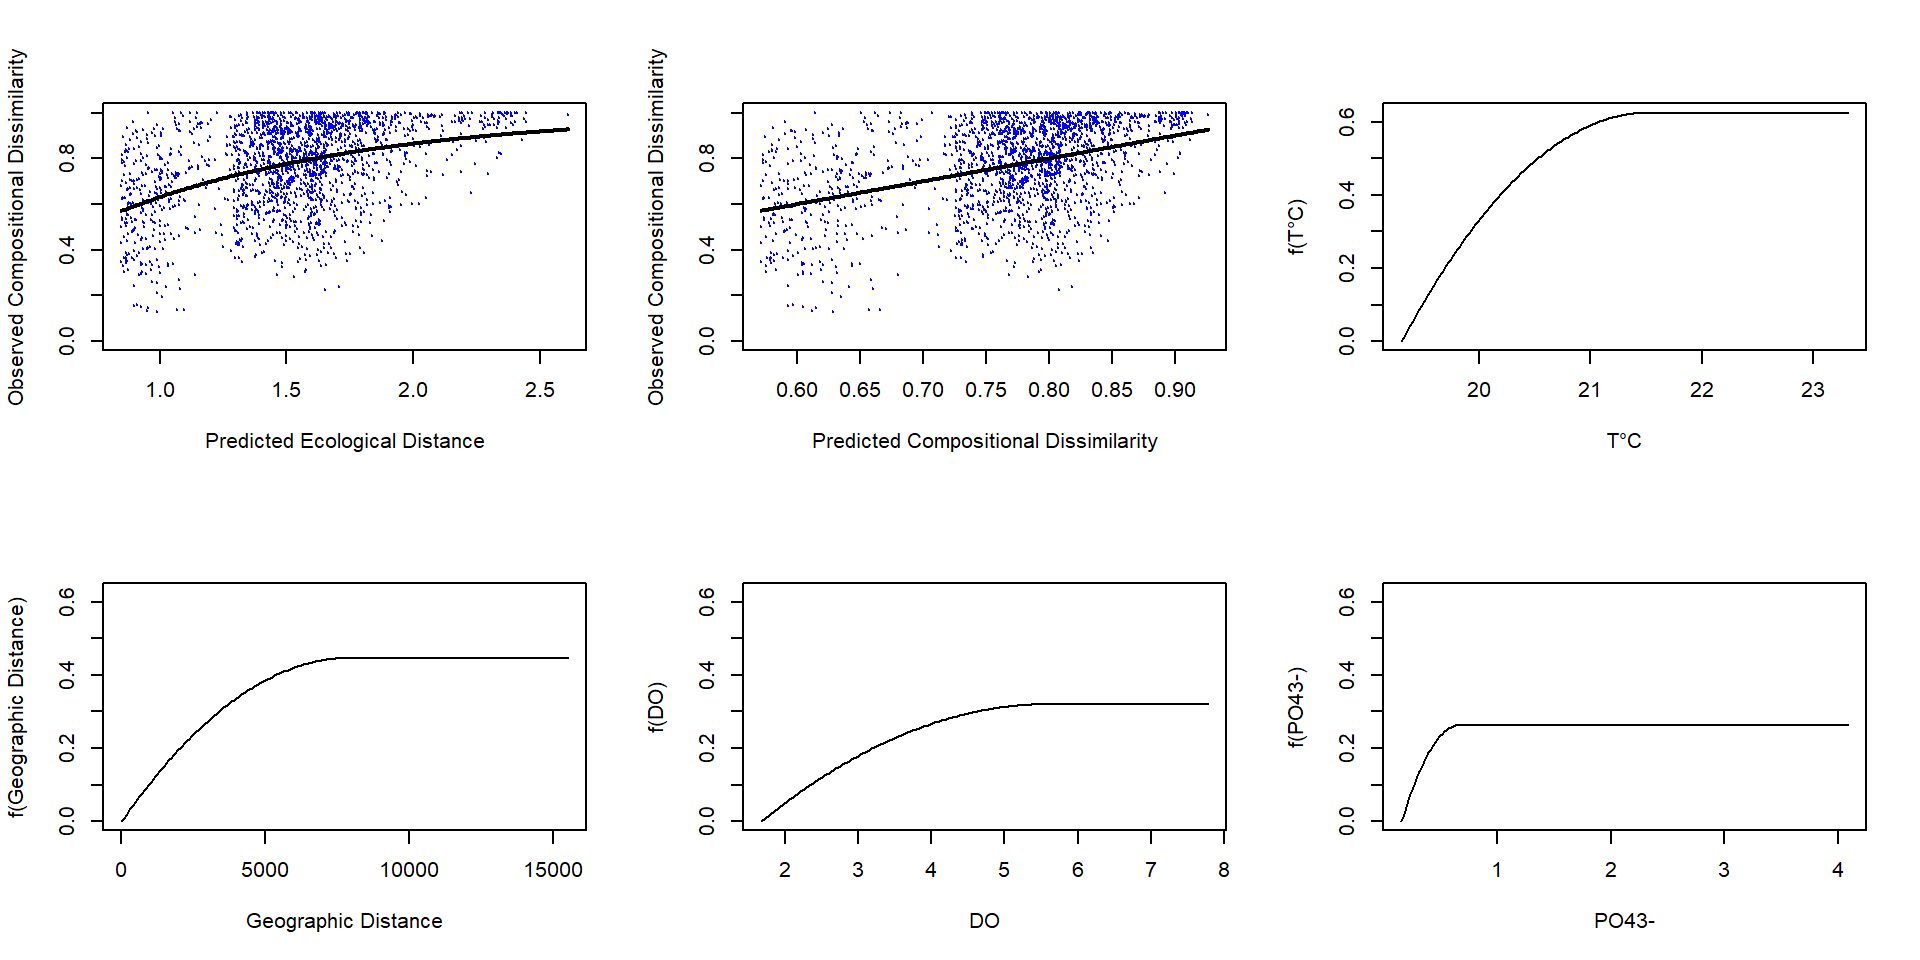
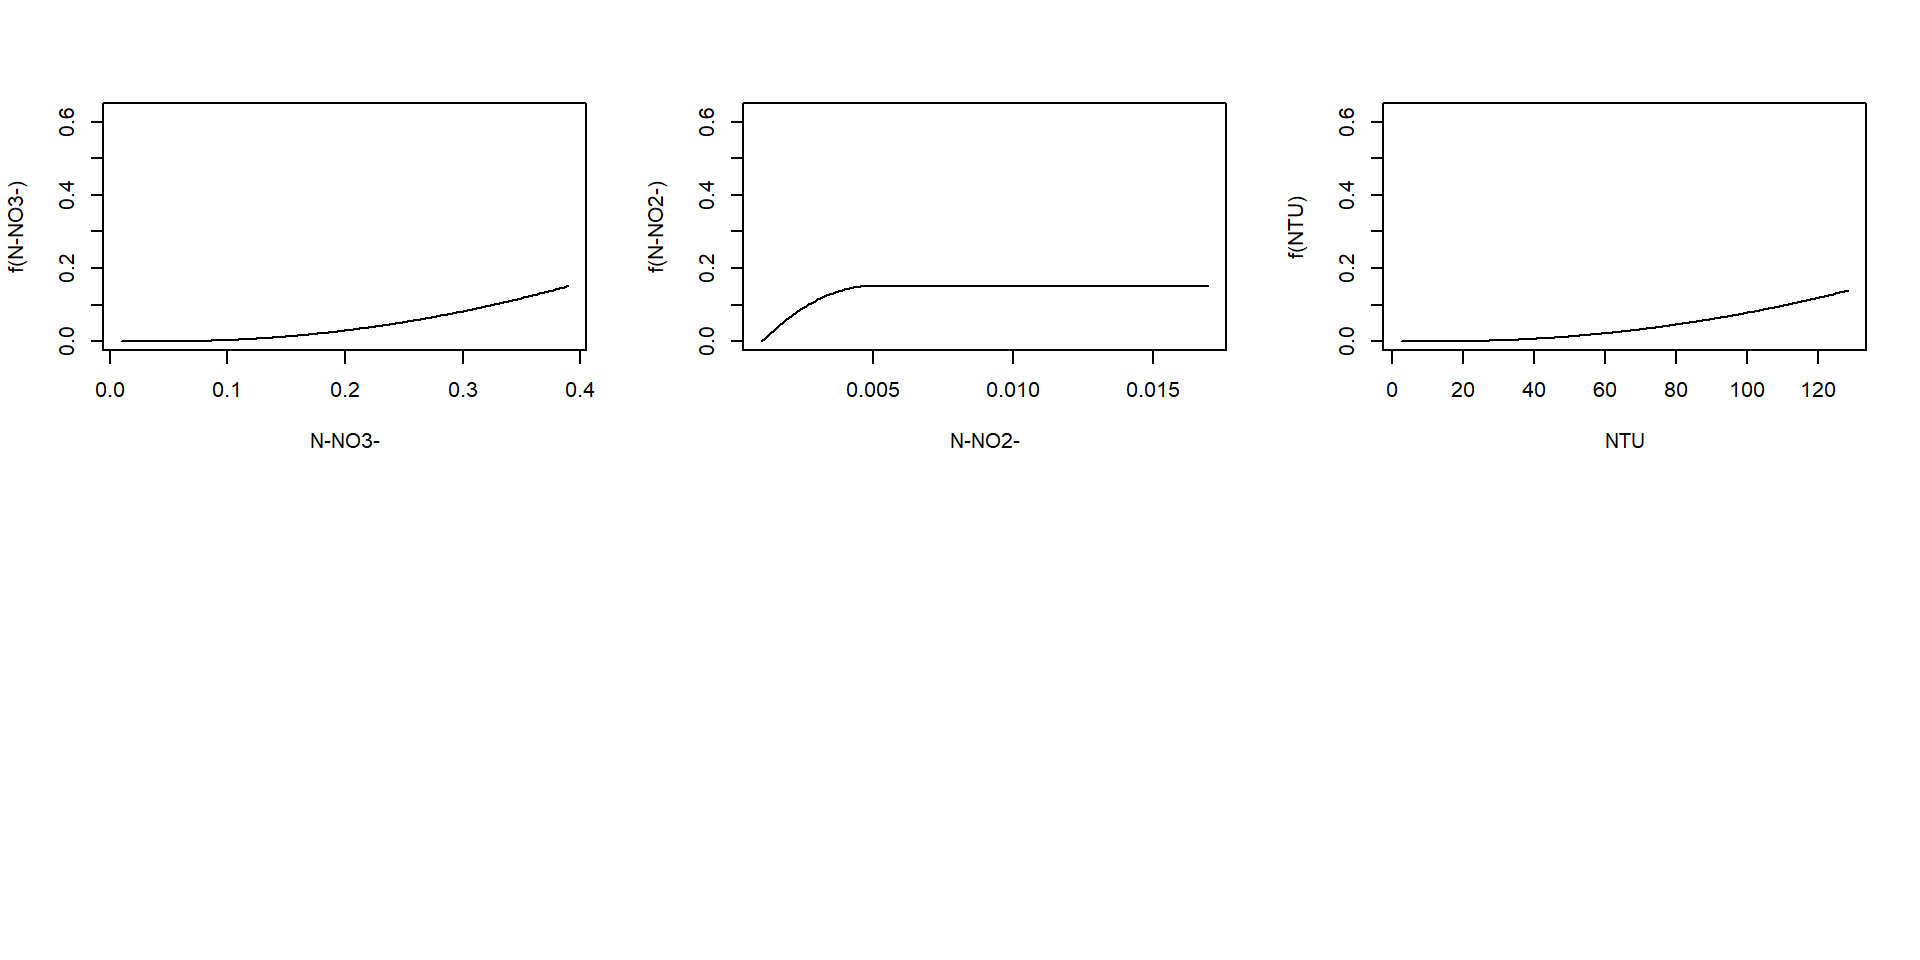
Podemos graficar los resultados del modelo y las curvas i-spline
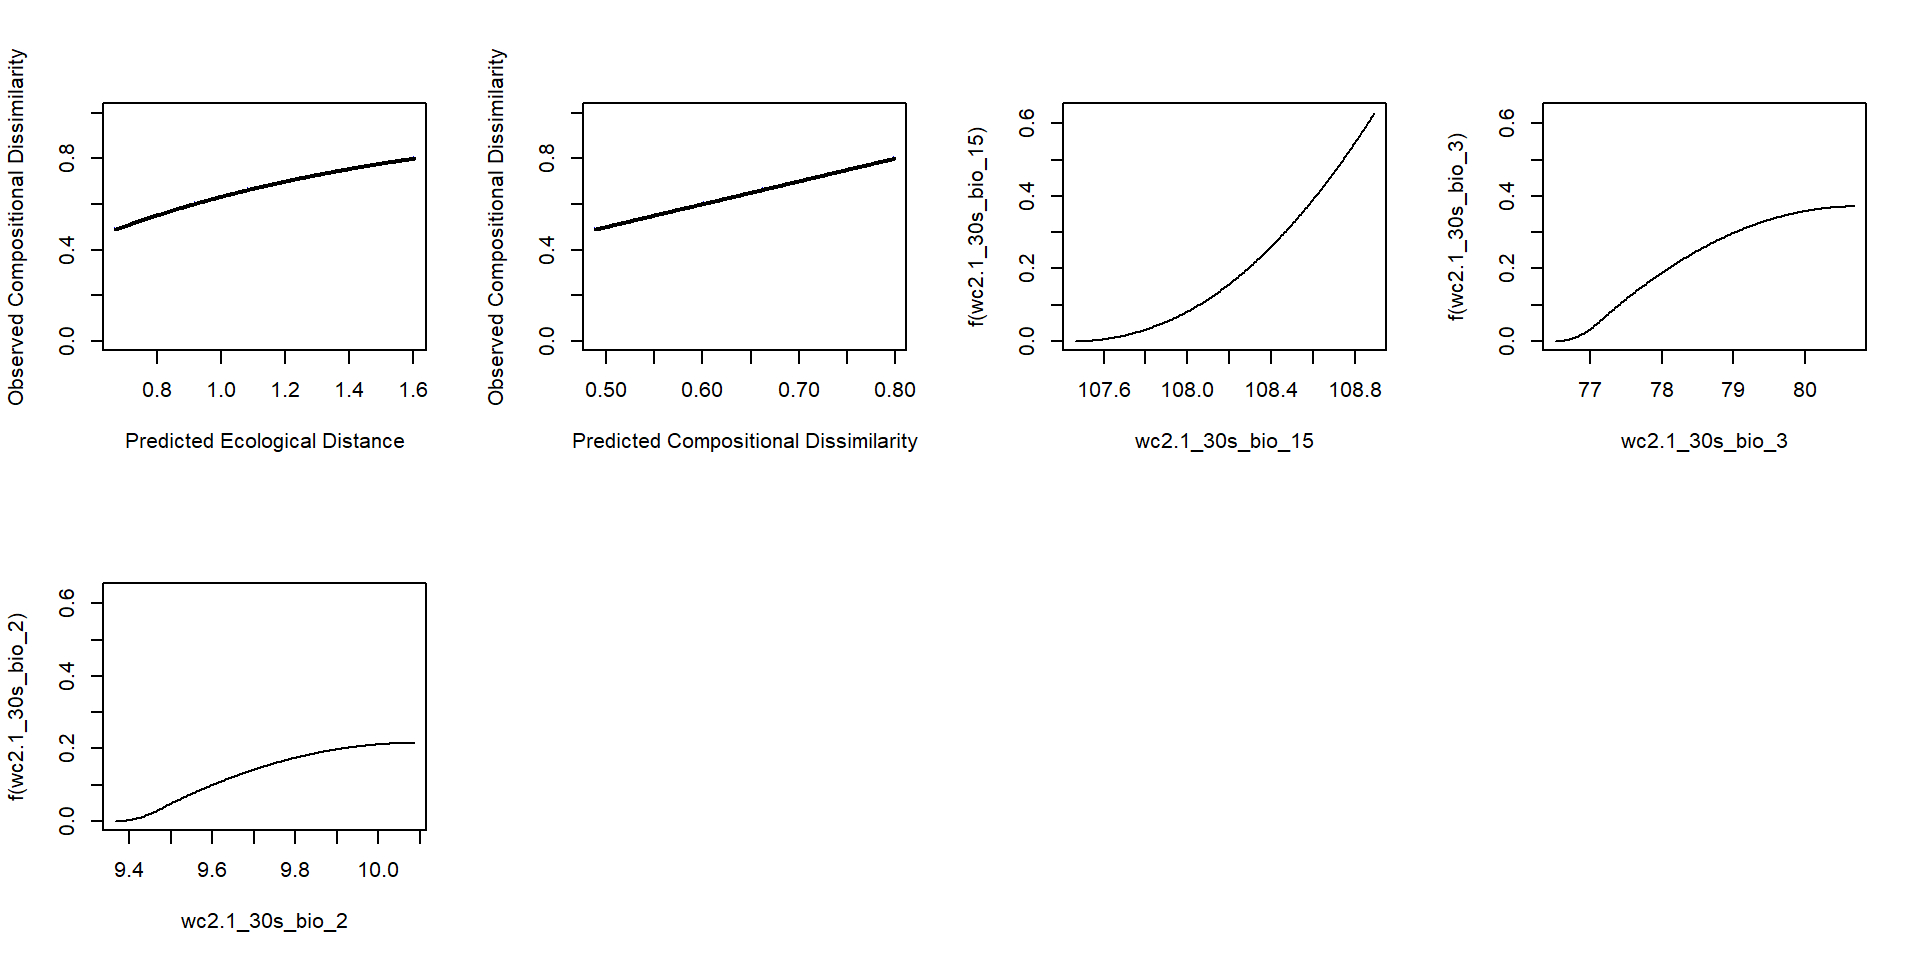
… también las del modelo bioclimático
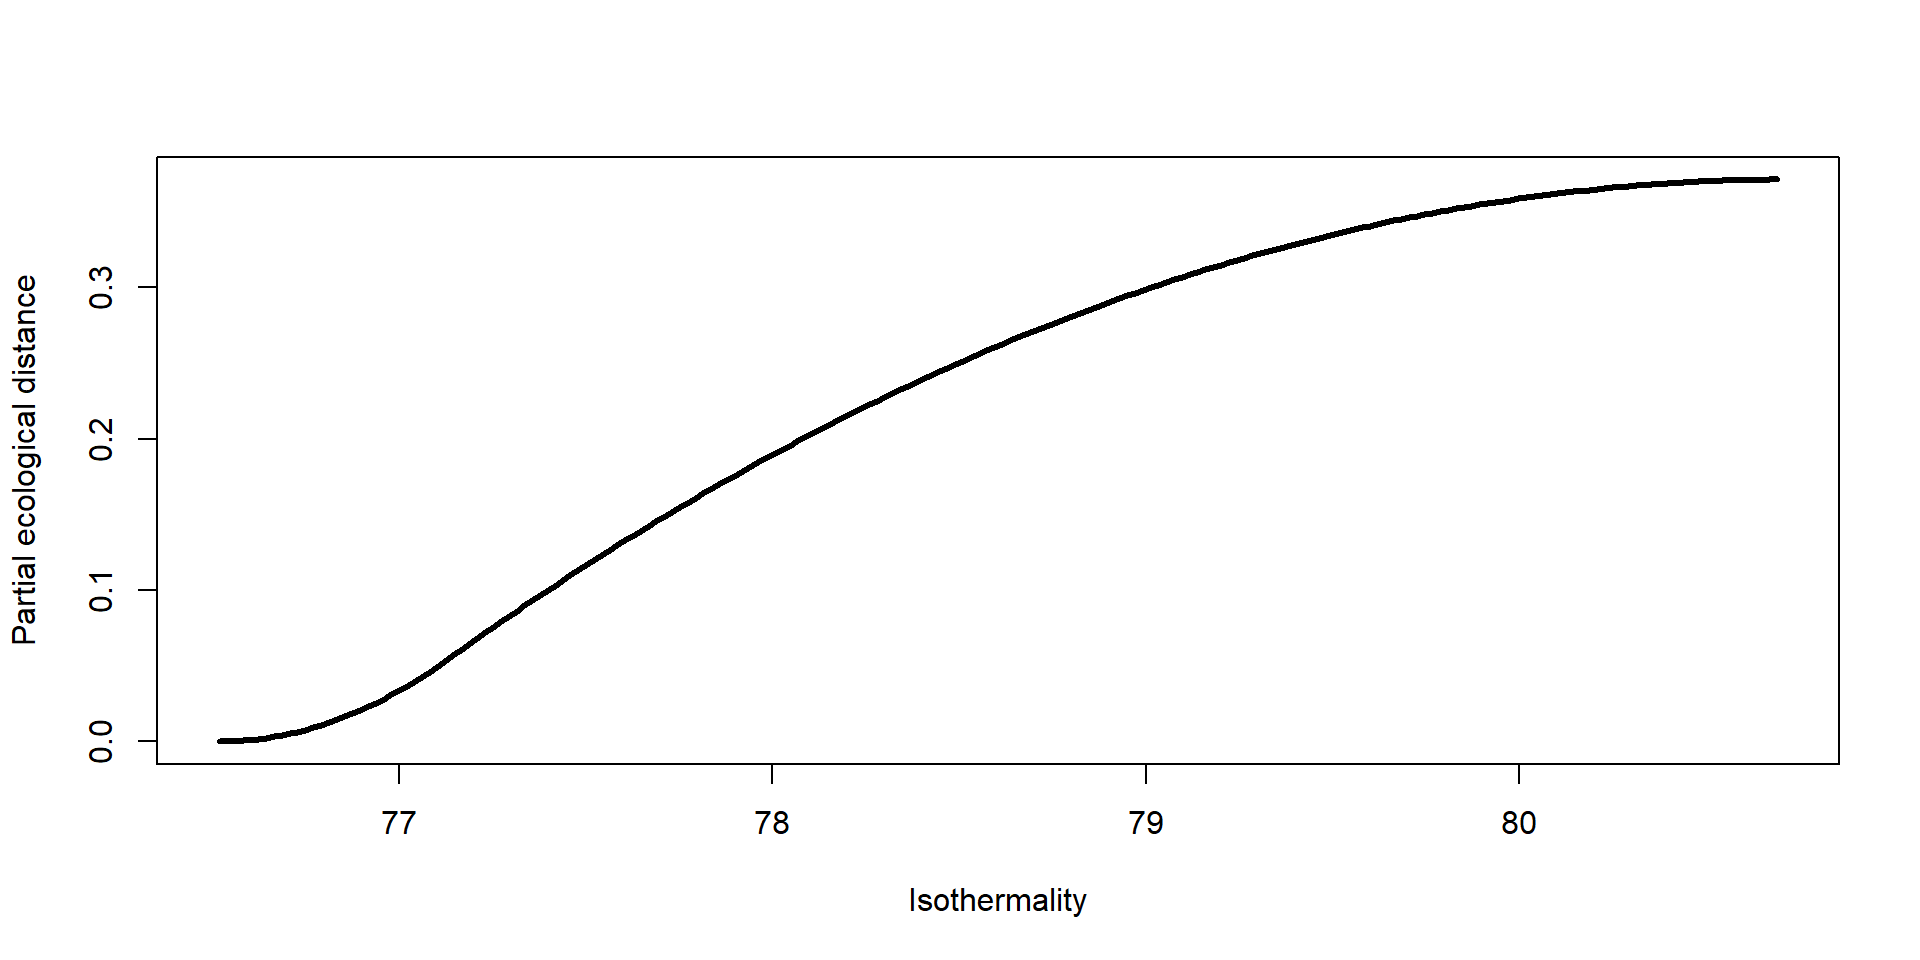
Si necesitamos realizar gráficos independientes, podemos extraer los valores de las curvas i-splines
List of 2
$ x: num [1:200, 1:20] 3877 3933 3990 4047 4104 ...
..- attr(*, "dimnames")=List of 2
.. ..$ : NULL
.. ..$ : chr [1:20] "Geographic" "wc2.1_30s_bio_1" "wc2.1_30s_bio_2" "wc2.1_30s_bio_3" ...
$ y: num [1:200, 1:20] 0 0 0 0 0 0 0 0 0 0 ...
..- attr(*, "dimnames")=List of 2
.. ..$ : NULL
.. ..$ : chr [1:20] "Geographic" "wc2.1_30s_bio_1" "wc2.1_30s_bio_2" "wc2.1_30s_bio_3" ...… y posteriormente graficarlas a mano
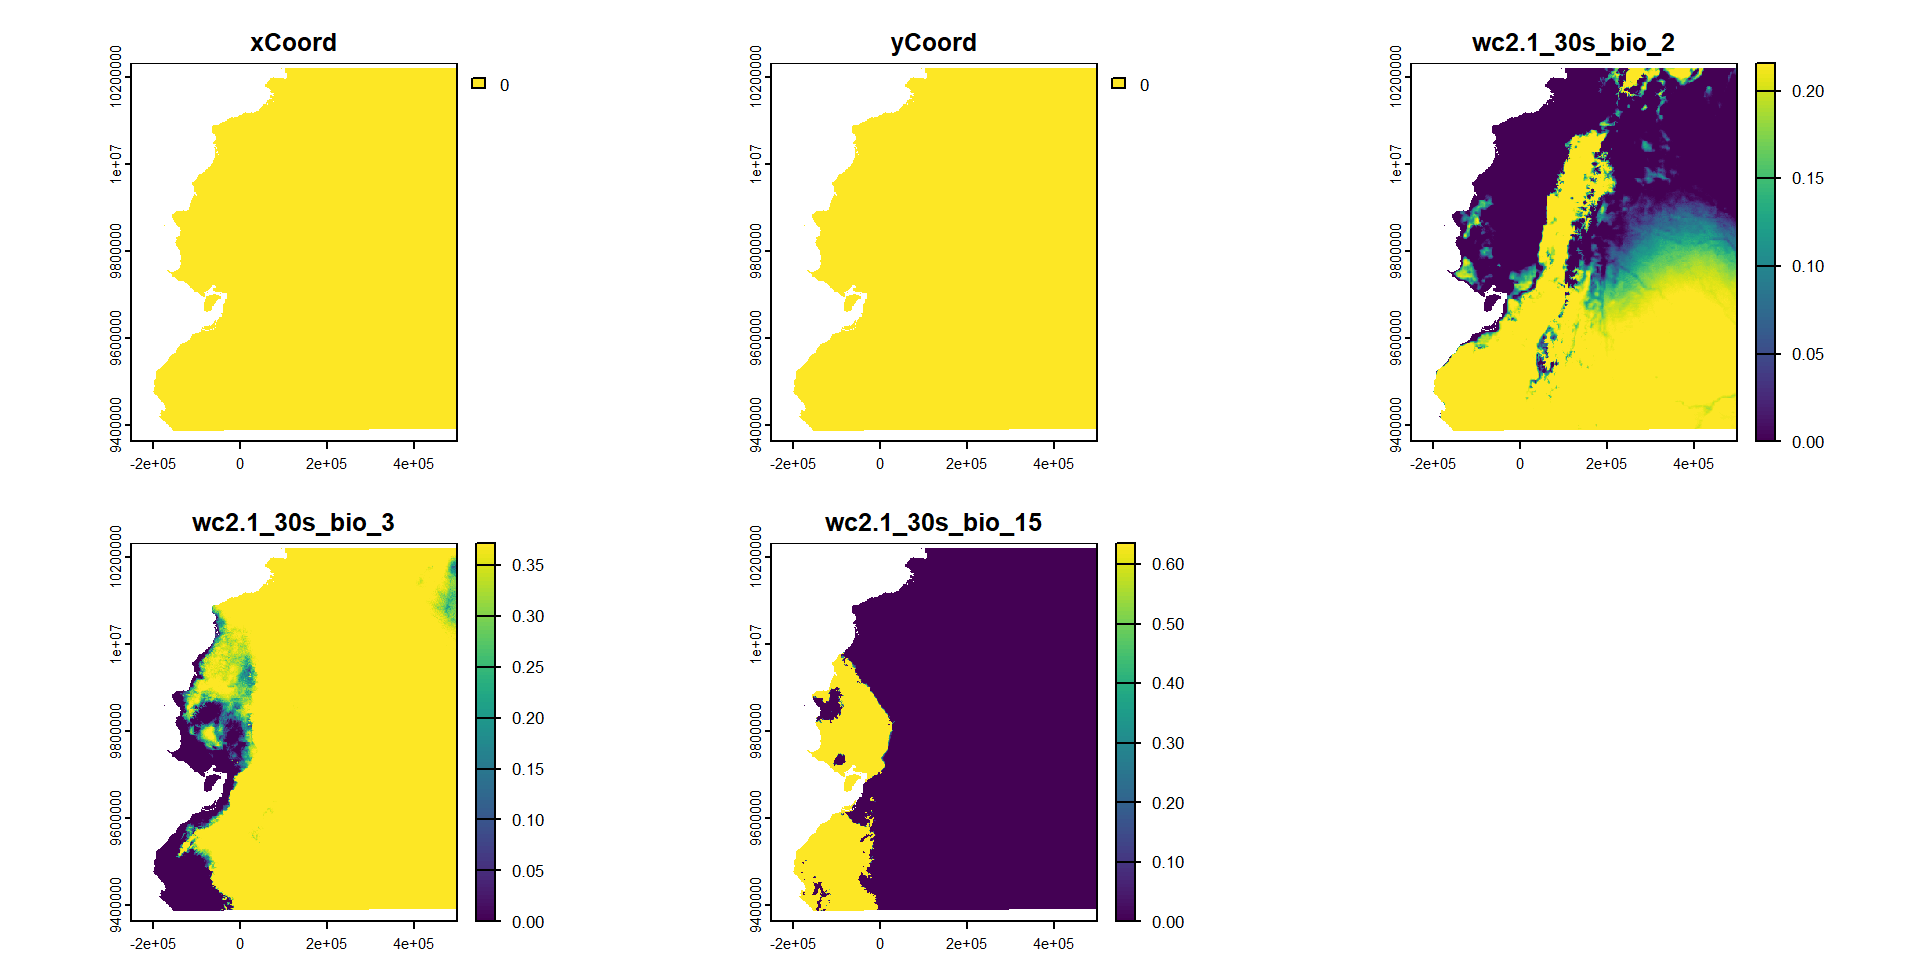
Usemos el modelo para realizar proyecciones
Podemos proyectar el modelo para transformar cada variable ambiental acorde a las i-splines
|---------|---------|---------|---------|
=========================================
class       : SpatRaster
size        : 925, 797, 5  (nrow, ncol, nlyr)
resolution  : 940.2445, 940.2445  (x, y)
extent      : -249628.5, 499746.5, 9362131, 10231857  (xmin, xmax, ymin, ymax)
coord. ref. : WGS 84 / UTM zone 18S (EPSG:32718)
source      : spat_6df41d0fd02_28148_zxzxx9jyyx6UnnI.tif
names       : xCoord, yCoord, wc2.1_~_bio_2, wc2.1_~_bio_3, wc2.1_~bio_15
min values  :      0,      0,     0.0000000,     0.0000000,     0.0000000
max values  :      0,      0,     0.2157599,     0.3712488,     0.6358249
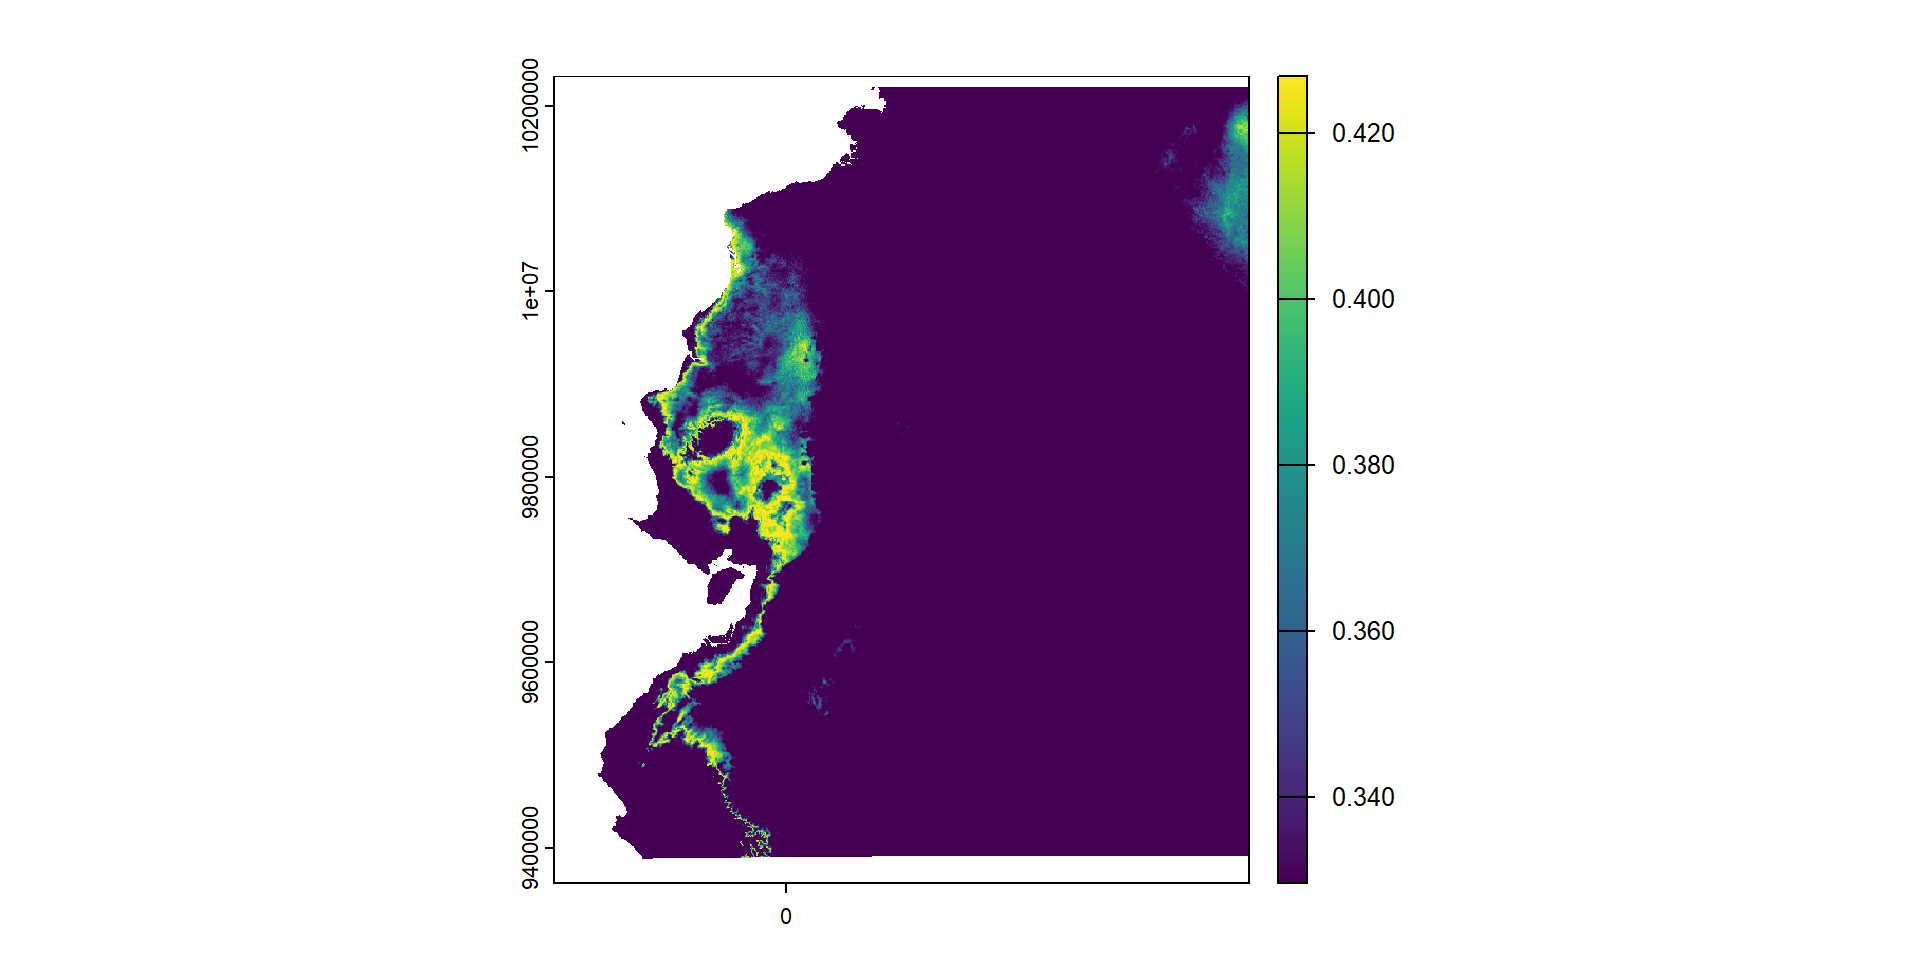
… y graficarlo en forma de mapa
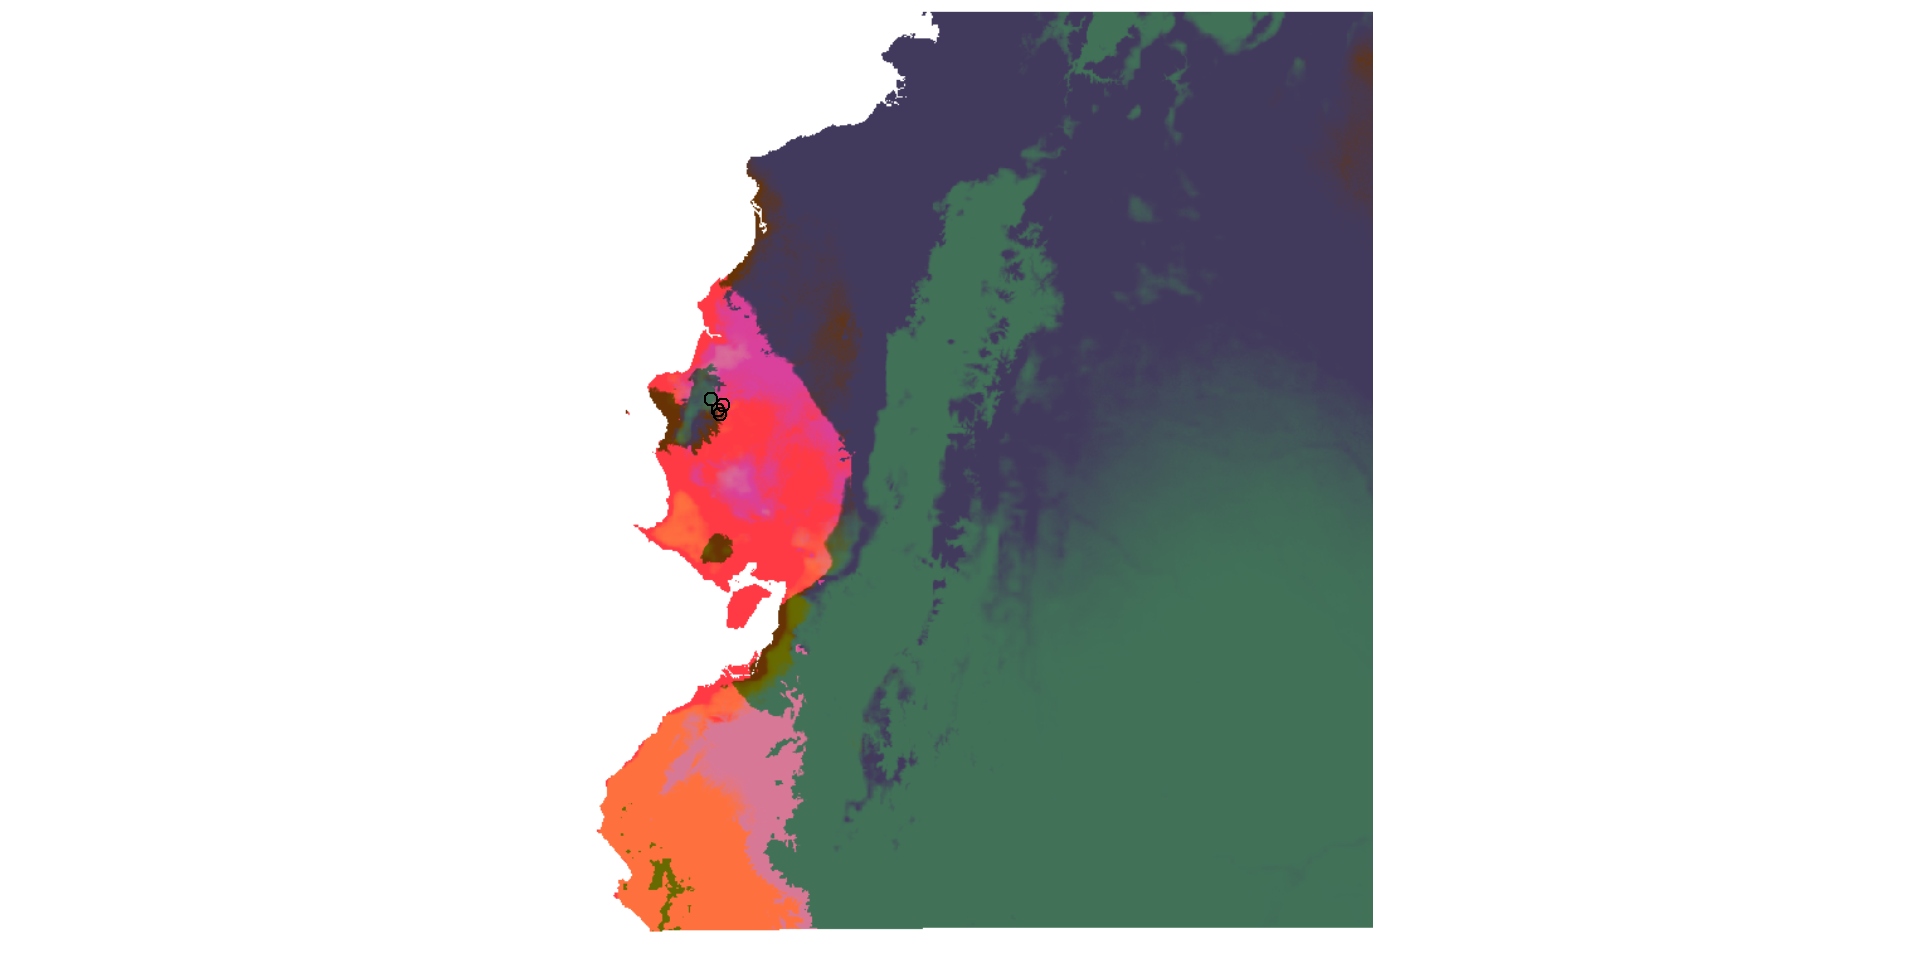
Para reducir la dimensionalidad de las distintas capas, usamos un ACP para seleccionar los tres primeros ejes
class       : SpatRaster
size        : 925, 797, 3  (nrow, ncol, nlyr)
resolution  : 940.2445, 940.2445  (x, y)
extent      : -249628.5, 499746.5, 9362131, 10231857  (xmin, xmax, ymin, ymax)
coord. ref. : WGS 84 / UTM zone 18S (EPSG:32718)
source(s)   : memory
names       :       PC1,       PC2,     PC3
min values  :  65.82556,  51.35117,   0.000
max values  : 255.00000, 120.79050, 156.447
Y luego representar cada eje como un componente de color (rojo, azul y verde)
También podemos analizar cambios en cada pixel entre dos periodos concretos
Primero habrá que generar un objeto raster con los datos climáticos modificados