vignette("a1_Data_downloading_and_preprocessing") before
going on.
TraCE21ka data
Original TraCE21ka data are in NetCDF format. However, they have
several characteristics that makes not straightforward to import them
using function from the loadeR package. Hence, we have
developed a set of wrapper functions to import those data into R with
the climate4r format. More specifically, to load the
TraCE21ka data for the historical period, we use the
dsclim::loadHistoricalTraceGrid() function. This function
requires the file (including the path to the file) and the variable name
(as it is specified in the data dictionary for standardization).
Optionally, the spatial coverage can be controlled, specifying an extent
by the longitudinal and latitudinal extents. In this tutorial we use the
same extent used to create our dsclim data for the Western Mediterranean
region.
Loading TraCE21ka data
The function also allow to specify the starting and ending year of the desired period. If not specified, it uses the period 1961 to 1990, both years included.
Once the data are loaded, we used the
transformeR::climatology() function to calculate the
average value of the variable for the whole period (e.g. 1961-1990).
Finally, the visualizeR::spatialPlot() function to plot the
resulting map.
Select a variable:
trace.tsmx <- dsclim::loadHistoricalTraceGrid("Data/TraCE21ka/TSMX/trace.36.400BP-1990CE.cam2.h0.TSMX.2160101-2204012.nc", var = "tasmax", lon_lim = trace.lon, lat_lim = trace.lat, years = 1961:1990)

visualizeR::spatialPlot(transformeR::climatology(trace.tsmx), backdrop.theme = "countries", rev.colors = TRUE)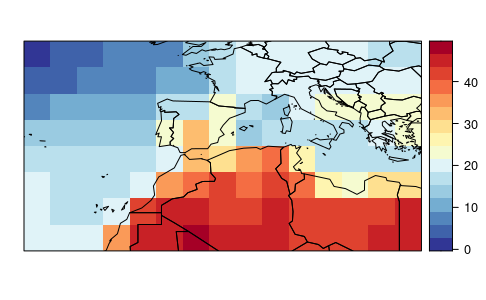
trace.tsmn <- dsclim::loadHistoricalTraceGrid("Data/TraCE21ka/TSMN/trace.36.400BP-1990CE.cam2.h0.TSMN.2160101-2204012.nc", var = "tasmin", lon_lim = trace.lon, lat_lim = trace.lat, years = 1961:1990)

visualizeR::spatialPlot(transformeR::climatology(trace.tsmn), backdrop.theme = "countries", rev.colors = TRUE)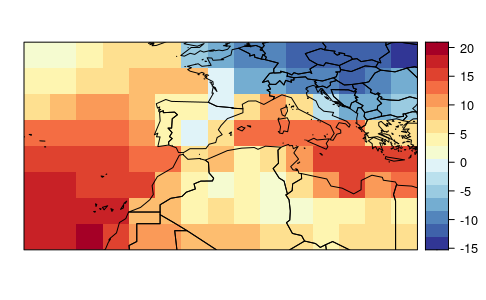
trace.ts <- dsclim::loadHistoricalTraceGrid("Data/TraCE21ka/TS/trace.36.400BP-1990CE.cam2.h0.TS.2160101-2204012.nc", var = "tas", lon_lim = trace.lon, lat_lim = trace.lat, years = 1961:1990)

visualizeR::spatialPlot(transformeR::climatology(trace.ts), backdrop.theme = "countries", rev.colors = TRUE)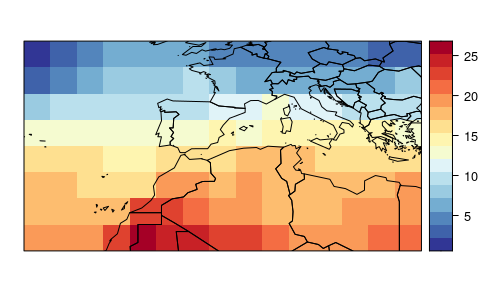
trace.precc <- dsclim::loadHistoricalTraceGrid("Data/TraCE21ka/PRECC/trace.36.400BP-1990CE.cam2.h0.PRECC.2160101-2204012.nc", var = "pr", lon_lim = trace.lon, lat_lim = trace.lat, years = 1961:1990)

visualizeR::spatialPlot(transformeR::climatology(trace.precc), backdrop.theme = "countries")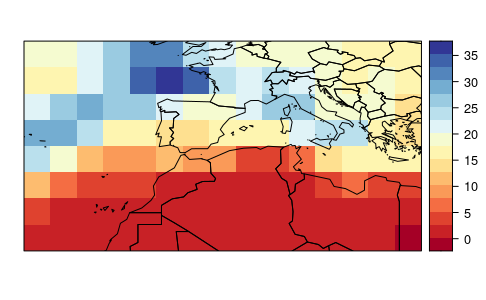
trace.relhum <- dsclim::loadHistoricalTraceGrid("Data/TraCE21ka/RELHUM/trace.36.400BP-1990CE.cam2.h0.RELHUM.2160101-2204012.nc", var = "hurs@992.5561", lon_lim = trace.lon, lat_lim = trace.lat, years = 1961:1990)

visualizeR::spatialPlot(transformeR::climatology(trace.relhum), backdrop.theme = "countries")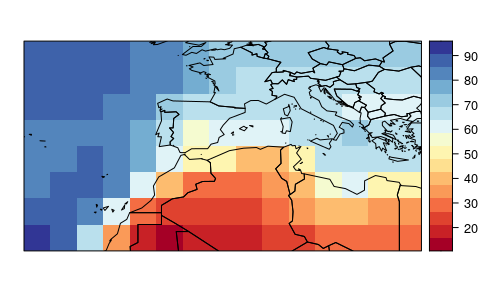
trace.cldtot <- dsclim::loadHistoricalTraceGrid("Data/TraCE21ka/CLDTOT/trace.36.400BP-1990CE.cam2.h0.CLDTOT.2160101-2204012.nc", var = "cld", lon_lim = trace.lon, lat_lim = trace.lat, years = 1961:1990)

visualizeR::spatialPlot(transformeR::climatology(trace.cldtot), backdrop.theme = "countries")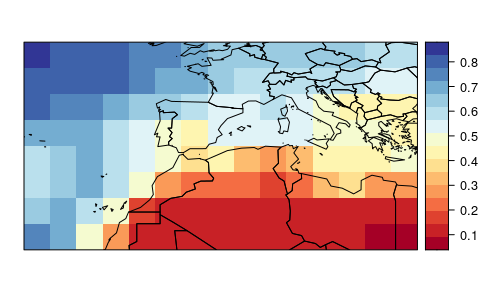
trace.ps <- dsclim::loadHistoricalTraceGrid("Data/TraCE21ka/PS/trace.36.400BP-1990CE.cam2.h0.PS.2160101-2204012.nc", var = "ps", lon_lim = trace.lon, lat_lim = trace.lat, years = 1961:1990)

visualizeR::spatialPlot(transformeR::climatology(trace.ps), backdrop.theme = "countries")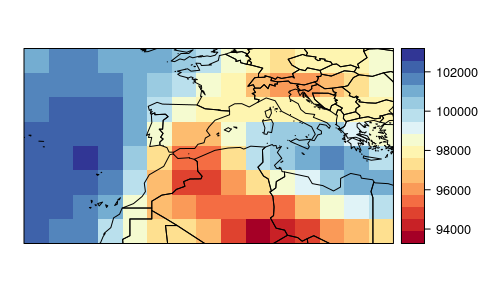
trace.u <- dsclim::loadHistoricalTraceGrid("Data/TraCE21ka/U/trace.36.400BP-1990CE.cam2.h0.U.2160101-2204012.nc", var = "u@992.5561", lon_lim = trace.lon, lat_lim = trace.lat, years = 1961:1990)

visualizeR::spatialPlot(transformeR::climatology(trace.u), backdrop.theme = "countries")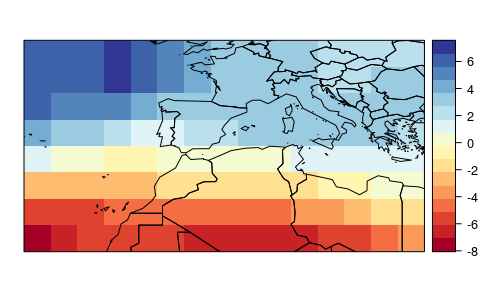
trace.v <- dsclim::loadHistoricalTraceGrid("Data/TraCE21ka/V/trace.36.400BP-1990CE.cam2.h0.V.2160101-2204012.nc", var = "v@992.5561", lon_lim = trace.lon, lat_lim = trace.lat, years = 1961:1990)

visualizeR::spatialPlot(transformeR::climatology(trace.v), backdrop.theme = "countries")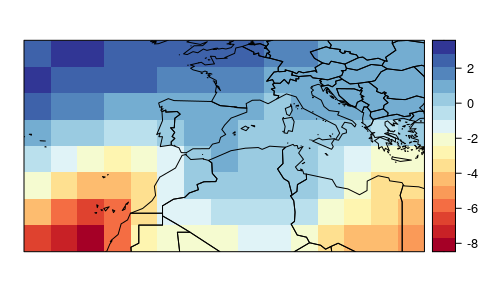
trace.wss <- dsclim::computeWindSpeed(trace.u, trace.v)

visualizeR::spatialPlot(transformeR::climatology(trace.wss), backdrop.theme = "countries")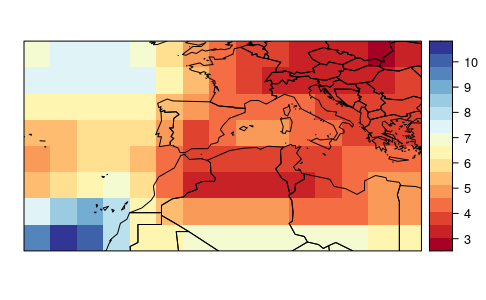
Make multivariable grid
The resulting objects can be combined in a multigrid object. This will be required afterwards to use all those variables as predictors in the downscaling process.
hist.trace <- transformeR::makeMultiGrid(trace.tsmx, trace.tsmn, trace.ts, trace.precc, trace.relhum, trace.cldtot, trace.ps, trace.wss)

rm(trace.tsmx, trace.tsmn, trace.ts, trace.precc, trace.relhum, trace.cldtot, trace.ps, trace.wss, trace.u, trace.v)

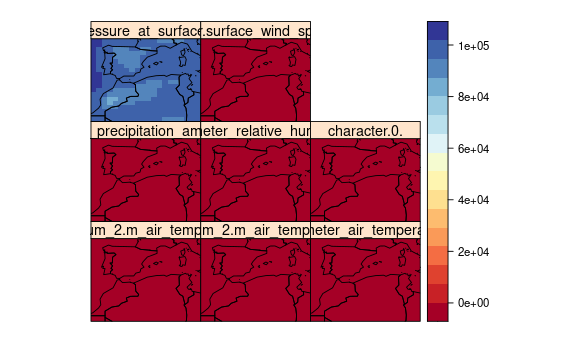
visualizeR::spatialPlot(transformeR::climatology(hist.trace), backdrop.theme = "countries")
UERRA historical reanalisis data
The UERRA dataset were transformed after downloading to reproject
them (see code in the vignette
vignette("a1_Data_downloading_and_preprocessing")). As
result of such transformation, we obtained NetCDF files that can be
directly imported in R using the loadGridData() from the
loadeR package. This function also allow to specify a
geographical region to subset the loaded data.
Loading UERRA data
Now, we load the tailored data of the UERRA dataset for the period 1961-1990. More specifically, we loaded the same variables that we were interested to downscale. These grid objects were used as predictands in the downscale process.
Select a variable
uerra.tasmin <- loadeR::loadGridData("Data/UERRA/UERRA-HARMONIE/2m_temperature/latlon/1961-90_2m_tmin.nc", var = "tasmin", lonLim = uerra.lon, latLim = uerra.lat, dictionary = "Data/UERRA/dictionary.dic")

visualizeR::spatialPlot(transformeR::climatology(uerra.tasmin), main = "tasmin", backdrop.theme = "countries", rev.colors = TRUE, at = seq(-15, 40, 1))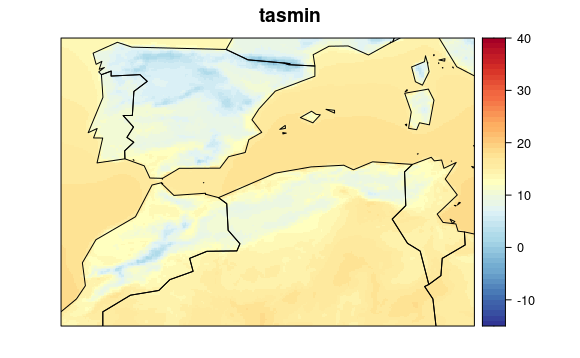
uerra.tas <- loadeR::loadGridData("Data/UERRA/UERRA-HARMONIE/2m_temperature/latlon/1961-90_2m_temperature.nc", var = "tas", lonLim = uerra.lon, latLim = uerra.lat, dictionary = "Data/UERRA/dictionary.dic")

visualizeR::spatialPlot(transformeR::climatology(uerra.tas), main = "tas", backdrop.theme = "countries", rev.colors = TRUE, at = seq(-15, 40, 1))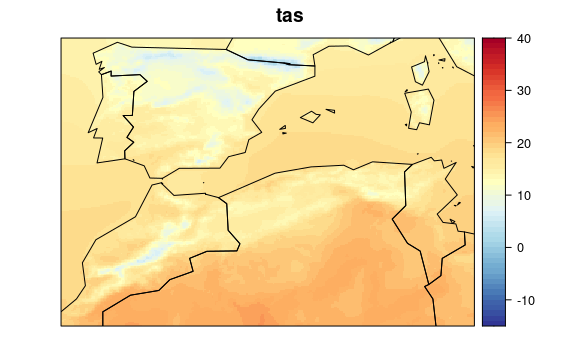
uerra.tasmax <- loadeR::loadGridData("Data/UERRA/UERRA-HARMONIE/2m_temperature/latlon/1961-90_2m_tmax.nc", var = "tasmax", lonLim = uerra.lon, latLim = uerra.lat, dictionary = "Data/UERRA/dictionary.dic")

visualizeR::spatialPlot(transformeR::climatology(uerra.tasmax), main = "tasmax", backdrop.theme = "countries", rev.colors = TRUE, at = seq(-15, 40, 1))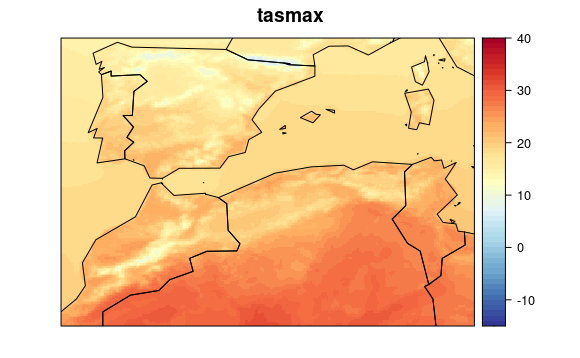
uerra.pr <- loadeR::loadGridData("Data/UERRA/MESCAN-SURFEX/total_precipitation/latlon/1961-90_total_precipitation.nc", var = "pr", lonLim = uerra.lon, latLim = uerra.lat, dictionary = "Data/UERRA/dictionary.dic")

uerra.pr <- transformeR::upscaleGrid(uerra.pr, times = 2, aggr.fun = list(FUN = mean))

uerra.pr <- transformeR::interpGrid(uerra.pr, new.coordinates = transformeR::getGrid(uerra.tas), method = "bilinear")

visualizeR::spatialPlot(transformeR::climatology(uerra.pr), main = "pr", backdrop.theme = "countries", at = seq(0, 400, 25))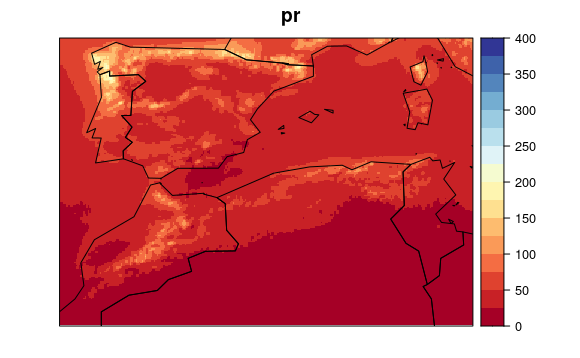
uerra.hurs <- loadeR::loadGridData("Data/UERRA/UERRA-HARMONIE/2m_relative_humidity/latlon/1961-90_2m_relative_humidity.nc", var = "hurs", lonLim = uerra.lon, latLim = uerra.lat, dictionary = "Data/UERRA/dictionary.dic")

visualizeR::spatialPlot(transformeR::climatology(uerra.hurs), main = "hurs", backdrop.theme = "countries", rev.colors = TRUE)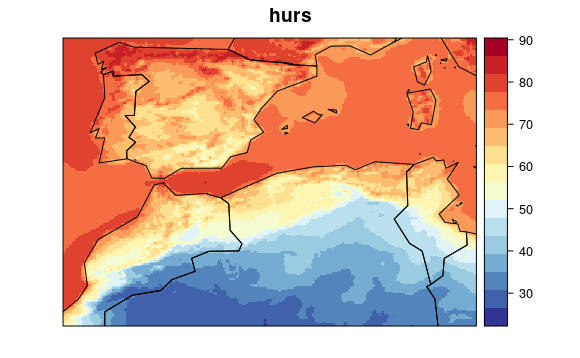
uerra.ps <- loadeR::loadGridData("Data/UERRA/UERRA-HARMONIE/surface_pressure/latlon/1961-90_surface_pressure.nc", var = "ps", lonLim = uerra.lon, latLim = uerra.lat, dictionary = "Data/UERRA/dictionary.dic")

visualizeR::spatialPlot(transformeR::climatology(uerra.ps), main = "ps", backdrop.theme = "countries", rev.colors = TRUE)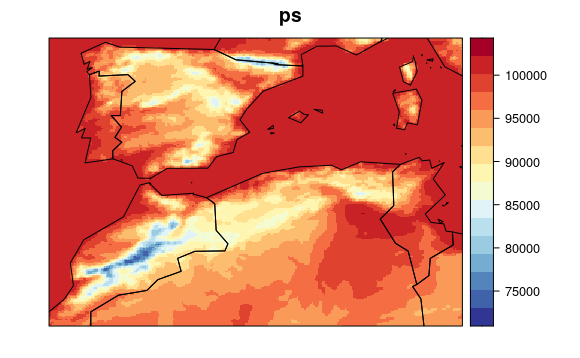
uerra.cld <- loadeR::loadGridData("Data/UERRA/UERRA-HARMONIE/total_cloud_cover/latlon/1961-90_total_cloud_cover.nc", var = "cld", lonLim = uerra.lon, latLim = uerra.lat, dictionary = "Data/UERRA/dictionary.dic")

visualizeR::spatialPlot(transformeR::climatology(uerra.cld), main = "cld", backdrop.theme = "countries", rev.colors = TRUE)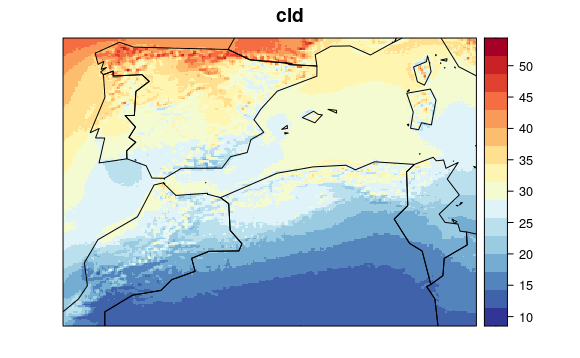
uerra.wss <- loadeR::loadGridData("Data/UERRA/UERRA-HARMONIE/10m_wind_speed/latlon/1961-90_10m_wind_speed.nc", var = "wss", lonLim = uerra.lon, latLim = uerra.lat, dictionary = "Data/UERRA/dictionary.dic")

visualizeR::spatialPlot(transformeR::climatology(uerra.wss), main = "wss", backdrop.theme = "countries", rev.colors = TRUE)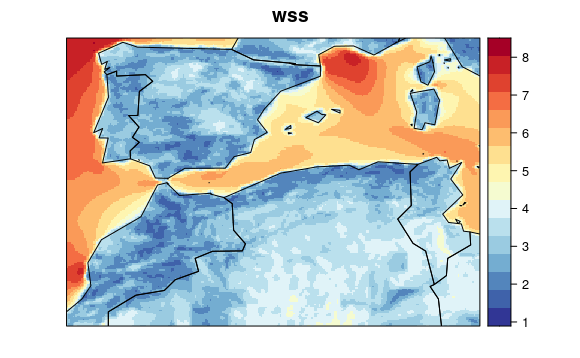
Fix dates
Dates from the UERRA files match the actual year and month, but are
interpreted as the central date of the month, rather than the whole
range of data. The modifyDates() function from the
dsclim package modify the dates and fix this small
issue.
uerra.tasmax <- modifyDates(uerra.tasmax)
uerra.tasmin <- modifyDates(uerra.tasmin)
uerra.tas <- modifyDates(uerra.tas)
uerra.pr <- modifyDates(uerra.pr)
uerra.ps <- modifyDates(uerra.ps)
uerra.hurs <- modifyDates(uerra.hurs)
uerra.cld <- modifyDates(uerra.cld)
uerra.wss <- modifyDates(uerra.wss)
CMIP5 future data
CMIP5 data can be directly loaded with the
loadGridData() from the loadeR package.
Here, we used the same extent than for TraCE21ka dataset. For this
example, we are going to use the data set from the rcp2.6 and CESM1-CAM5
combination of representative concentration pathways and general
circulation model.
Loading CMIP5 data
Select a variable
cmip.tasmin <- loadeR::loadGridData("Data/CMIP5/historical/CESM1-CAM5_historical/tasmin_Amon_CESM1-CAM5_historical_r1i1p1_185001-200512.nc", var = "tasmin", lonLim = cmip5.lon, latLim = cmip5.lat, years = 1961:1990, dictionary = "Data/CMIP5/dictionary.dic")

visualizeR::spatialPlot(transformeR::climatology(cmip.tasmin), main = "tasmin", backdrop.theme = "countries", rev.colors = TRUE, at = seq(-15, 40, 1))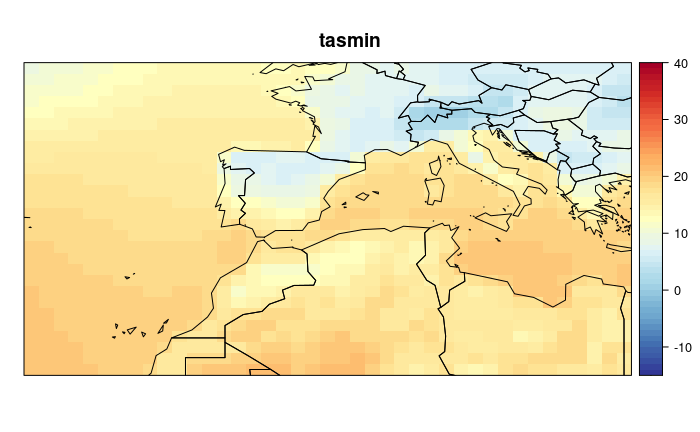
cmip.tas <- loadeR::loadGridData("Data/CMIP5/historical/CESM1-CAM5_historical/tas_Amon_CESM1-CAM5_historical_r1i1p1_185001-200512.nc", var = "tas", lonLim = cmip5.lon, latLim = cmip5.lat, years = 1961:1990, dictionary = "Data/CMIP5/dictionary.dic")

visualizeR::spatialPlot(transformeR::climatology(cmip.tas), main = "tas", backdrop.theme = "countries", rev.colors = TRUE, at = seq(-15, 40, 1))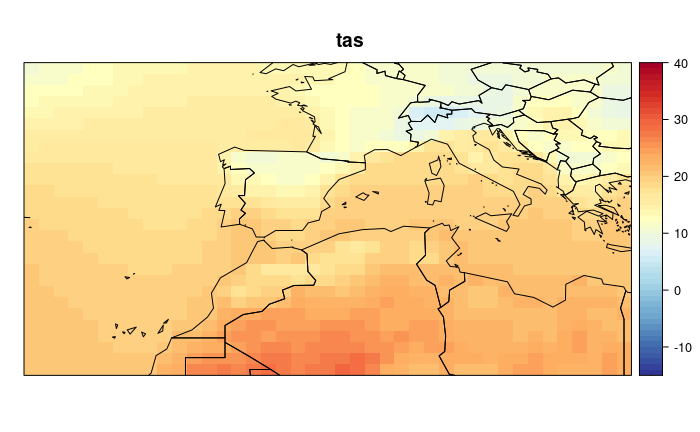
cmip.tasmax <- loadeR::loadGridData("Data/CMIP5/historical/CESM1-CAM5_historical/tasmax_Amon_CESM1-CAM5_historical_r1i1p1_185001-200512.nc", var = "tasmax", lonLim = cmip5.lon, latLim = cmip5.lat, years = 1961:1990, dictionary = "Data/CMIP5/dictionary.dic")

visualizeR::spatialPlot(transformeR::climatology(cmip.tasmax), main = "tasmax", backdrop.theme = "countries", rev.colors = TRUE, at = seq(-15, 40, 1))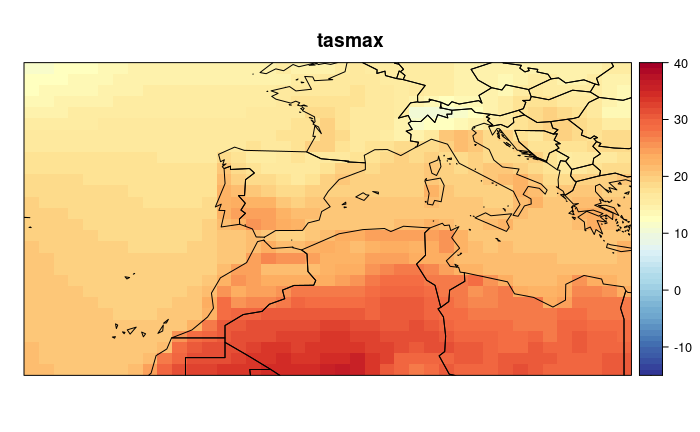
cmip.pr <- loadeR::loadGridData("Data/CMIP5/historical/CESM1-CAM5_historical/pr_Amon_CESM1-CAM5_historical_r1i1p1_185001-200512.nc", var = "pr", lonLim = cmip5.lon, latLim = cmip5.lat, years = 1961:1990, dictionary = "Data/CMIP5/dictionary.dic")

visualizeR::spatialPlot(transformeR::climatology(cmip.pr), main = "pr", backdrop.theme = "countries", at = seq(0, 400, 25))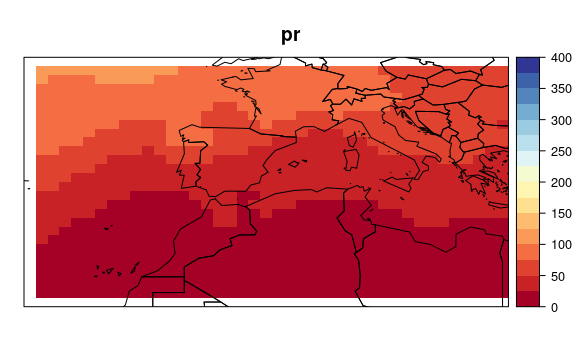
cmip.hurs <- loadeR::loadGridData("Data/CMIP5/historical/CESM1-CAM5_historical/hurs_Amon_CESM1-CAM5_historical_r1i1p1_185001-200512.nc", var = "hurs", lonLim = cmip5.lon, latLim = cmip5.lat, years = 1961:1990, dictionary = "Data/CMIP5/dictionary.dic")

visualizeR::spatialPlot(transformeR::climatology(cmip.hurs), main = "hurs", backdrop.theme = "countries", rev.colors = TRUE)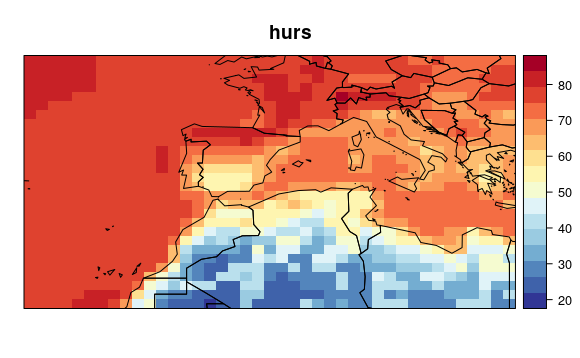
cmip.ps <- loadeR::loadGridData("Data/CMIP5/historical/CESM1-CAM5_historical/ps_Amon_CESM1-CAM5_historical_r1i1p1_185001-200512.nc", var = "ps", lonLim = cmip5.lon, latLim = cmip5.lat, years = 1961:1990, dictionary = "Data/CMIP5/dictionary.dic")

visualizeR::spatialPlot(transformeR::climatology(cmip.ps), main = "ps", backdrop.theme = "countries", rev.colors = TRUE)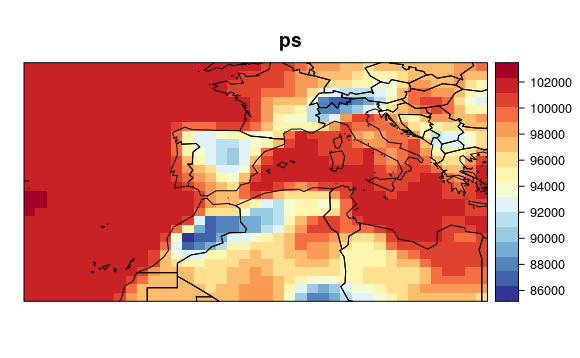
cmip.cld <- loadeR::loadGridData("Data/CMIP5/historical/CESM1-CAM5_historical/clt_Amon_CESM1-CAM5_historical_r1i1p1_185001-200512.nc", var = "cld", lonLim = cmip5.lon, latLim = cmip5.lat, years = 1961:1990, dictionary = "Data/CMIP5/dictionary.dic")

visualizeR::spatialPlot(transformeR::climatology(cmip.cld), main = "cld", backdrop.theme = "countries", rev.colors = TRUE)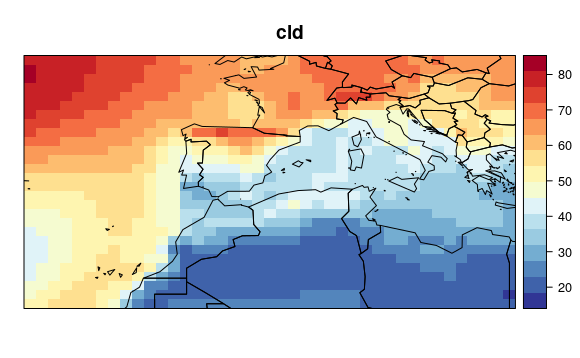
cmip.wss <- loadeR::loadGridData("Data/CMIP5/historical/CESM1-CAM5_historical/sfcWind_Amon_CESM1-CAM5_historical_r1i1p1_185001-200512.nc", var = "wss", lonLim = cmip5.lon, latLim = cmip5.lat, years = 1961:1990, dictionary = "Data/CMIP5/dictionary.dic")

visualizeR::spatialPlot(transformeR::climatology(cmip.wss), main = "wss", backdrop.theme = "countries", rev.colors = TRUE)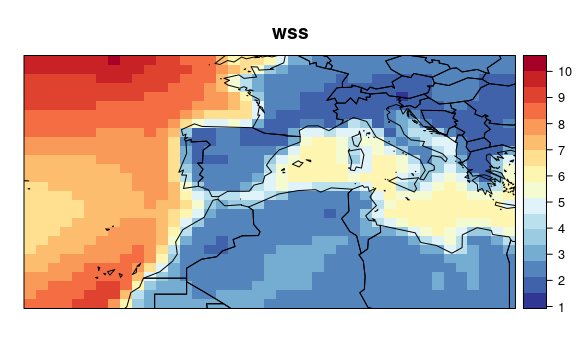
Fix dates
Similarly to the UERRA data, dates from the CMIP5 files match the
actual year and month, but are interpreted as the central date of the
month, rather than the whole range of data. Again, the
modifyDates() function from the dsclim
package modify the dates and fix helps to fix this small issue.
cmip.tasmax <- modifyDates(cmip.tasmax)
cmip.tasmin <- modifyDates(cmip.tasmin)
cmip.tas <- modifyDates(cmip.tas)
cmip.pr <- modifyDates(cmip.pr)
cmip.ps <- modifyDates(cmip.ps)
cmip.hurs <- modifyDates(cmip.hurs)
cmip.cld <- modifyDates(cmip.cld)
cmip.wss <- modifyDates(cmip.wss)
Make multivariable grid
Similarly to TraCE21ka dataset, the resulting objects for CMIP5 dataset can be combined in a multigrid object. This will be required afterwards to use all those variables as predictors in the downscaling process.
hist.cmip <- transformeR::makeMultiGrid(cmip.tasmax, cmip.tasmin, cmip.tas, cmip.pr, cmip.hurs, cmip.cld, cmip.ps, cmip.wss)

rm(cmip.tasmax, cmip.tasmin, cmip.tas, cmip.pr, cmip.hurs, cmip.cld, cmip.ps, cmip.wss)

visualizeR::spatialPlot(transformeR::climatology(hist.cmip), backdrop.theme = "countries")